


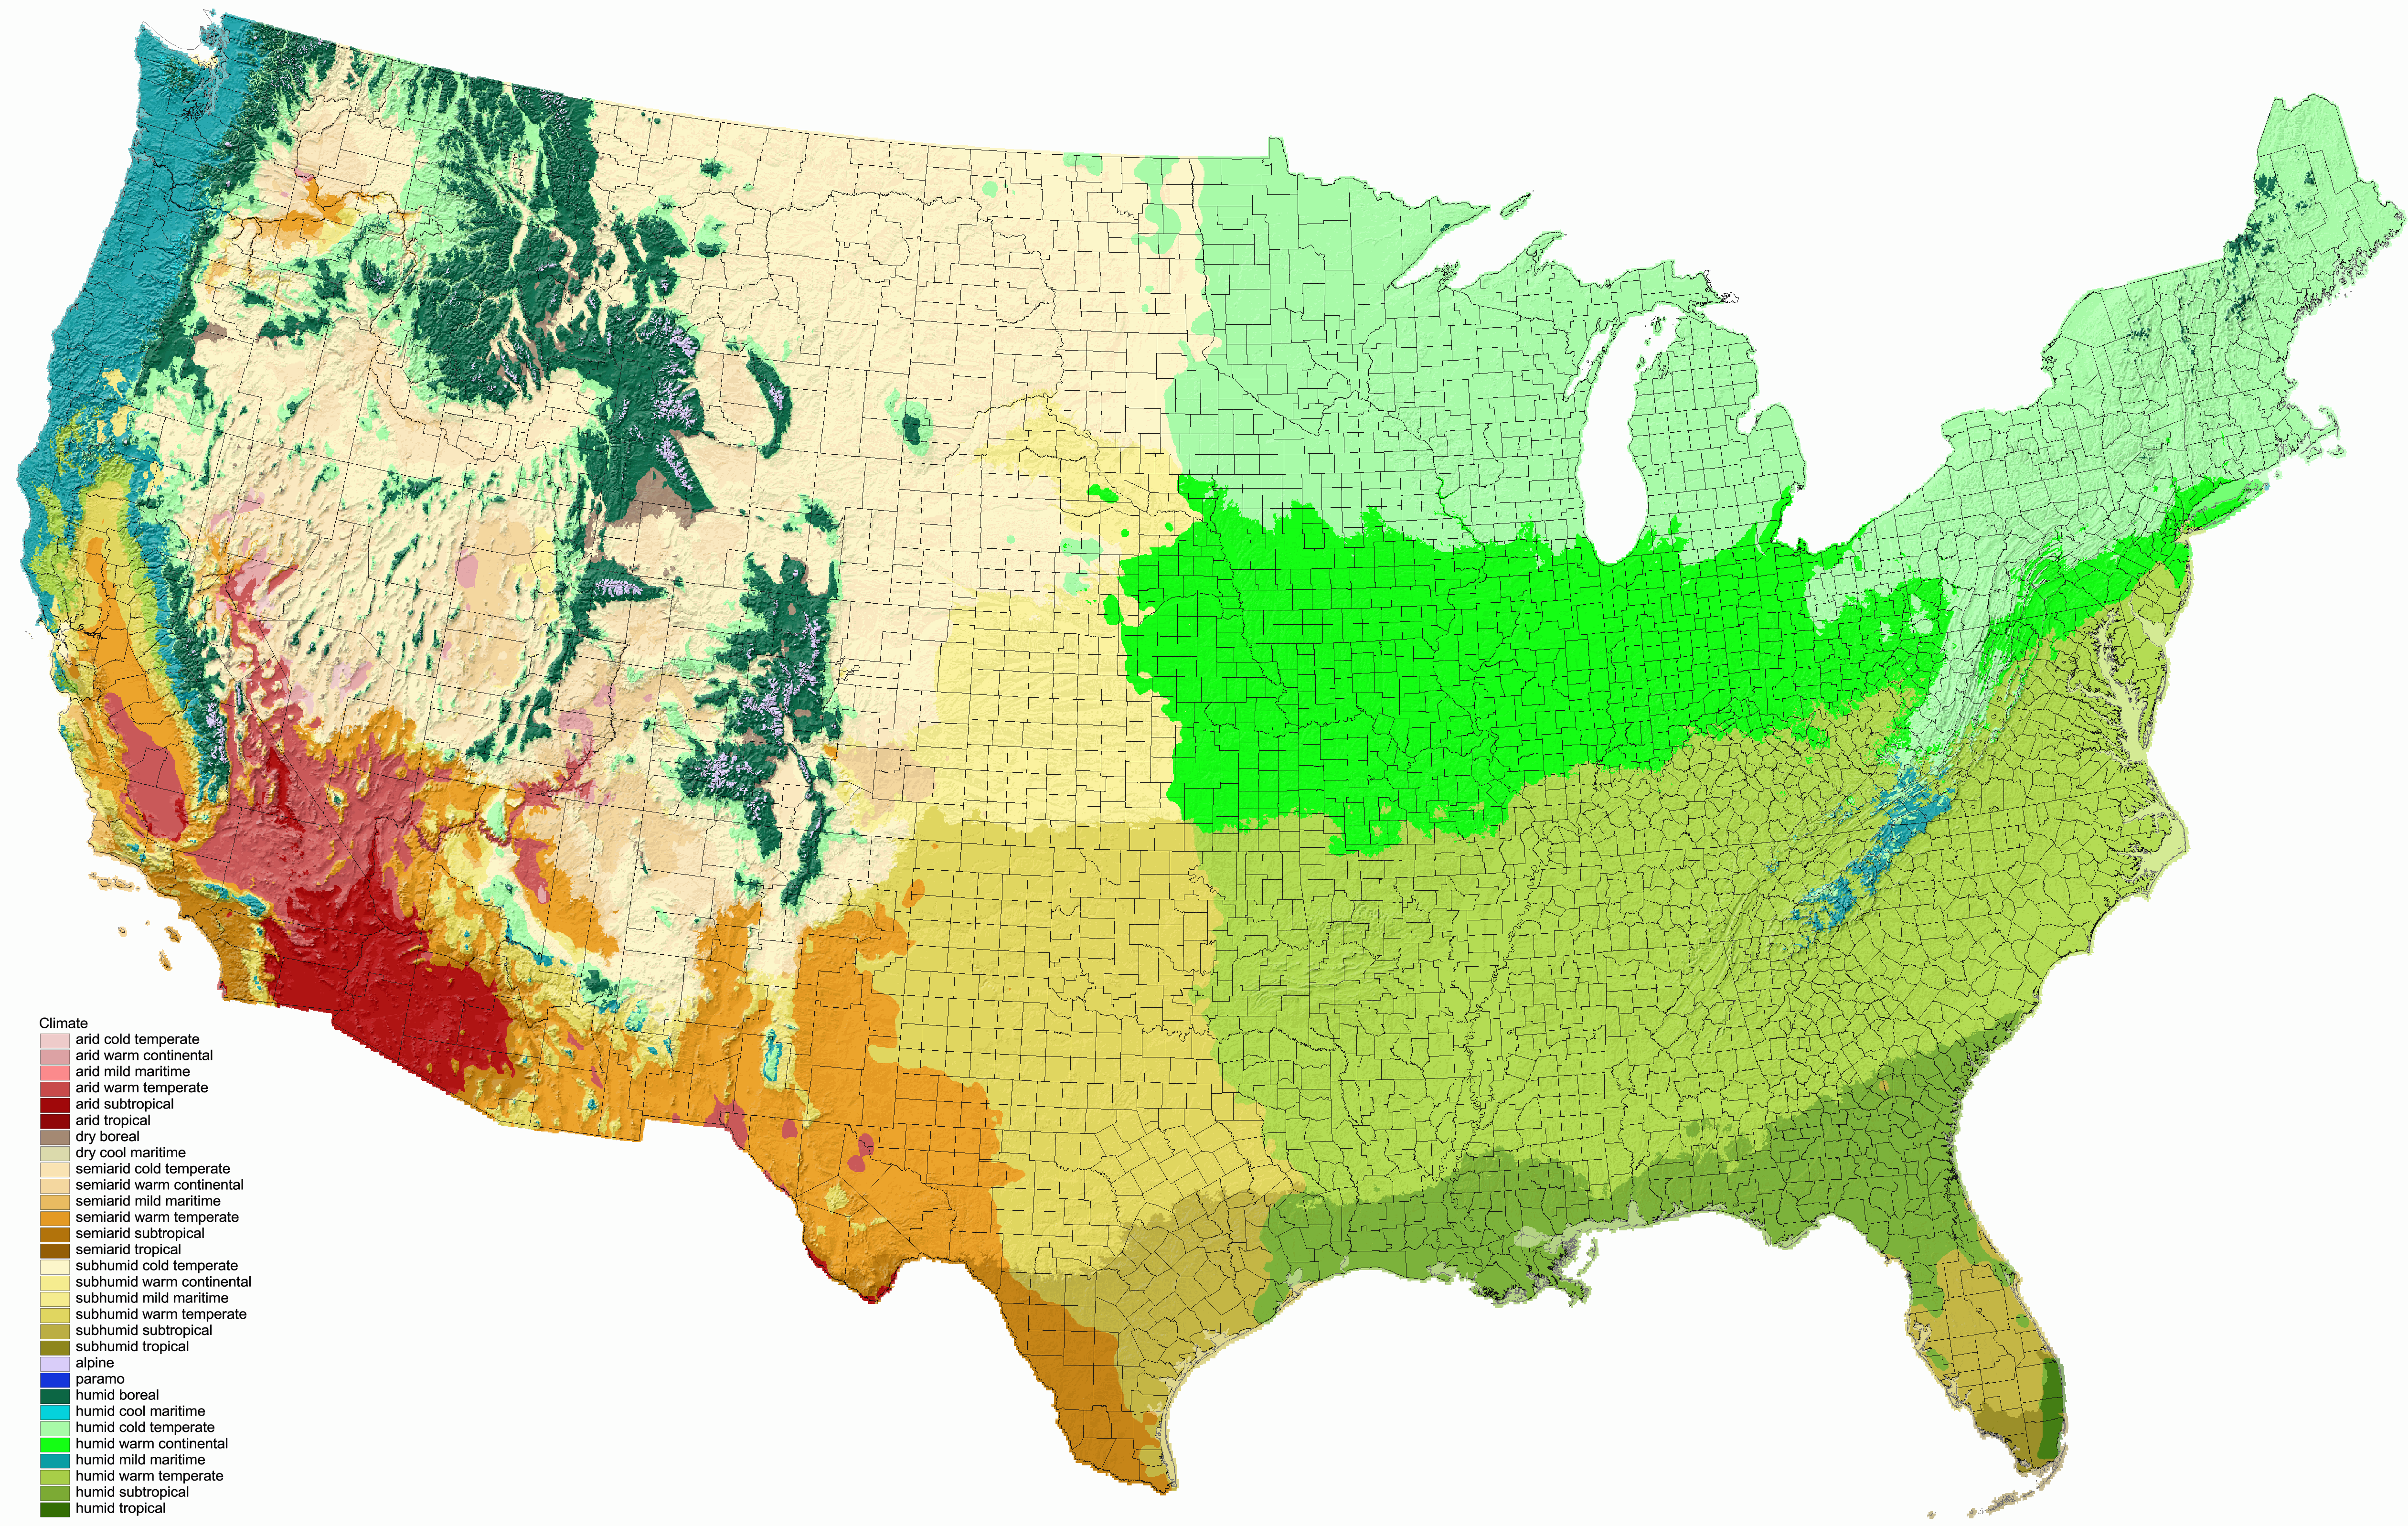
Climate zones of the Lower 48, based on zones of the warmest 6 months, coldest month, and moisture index (ratio of precipitation and positive temperature average; 1971-2000 data from PRISM
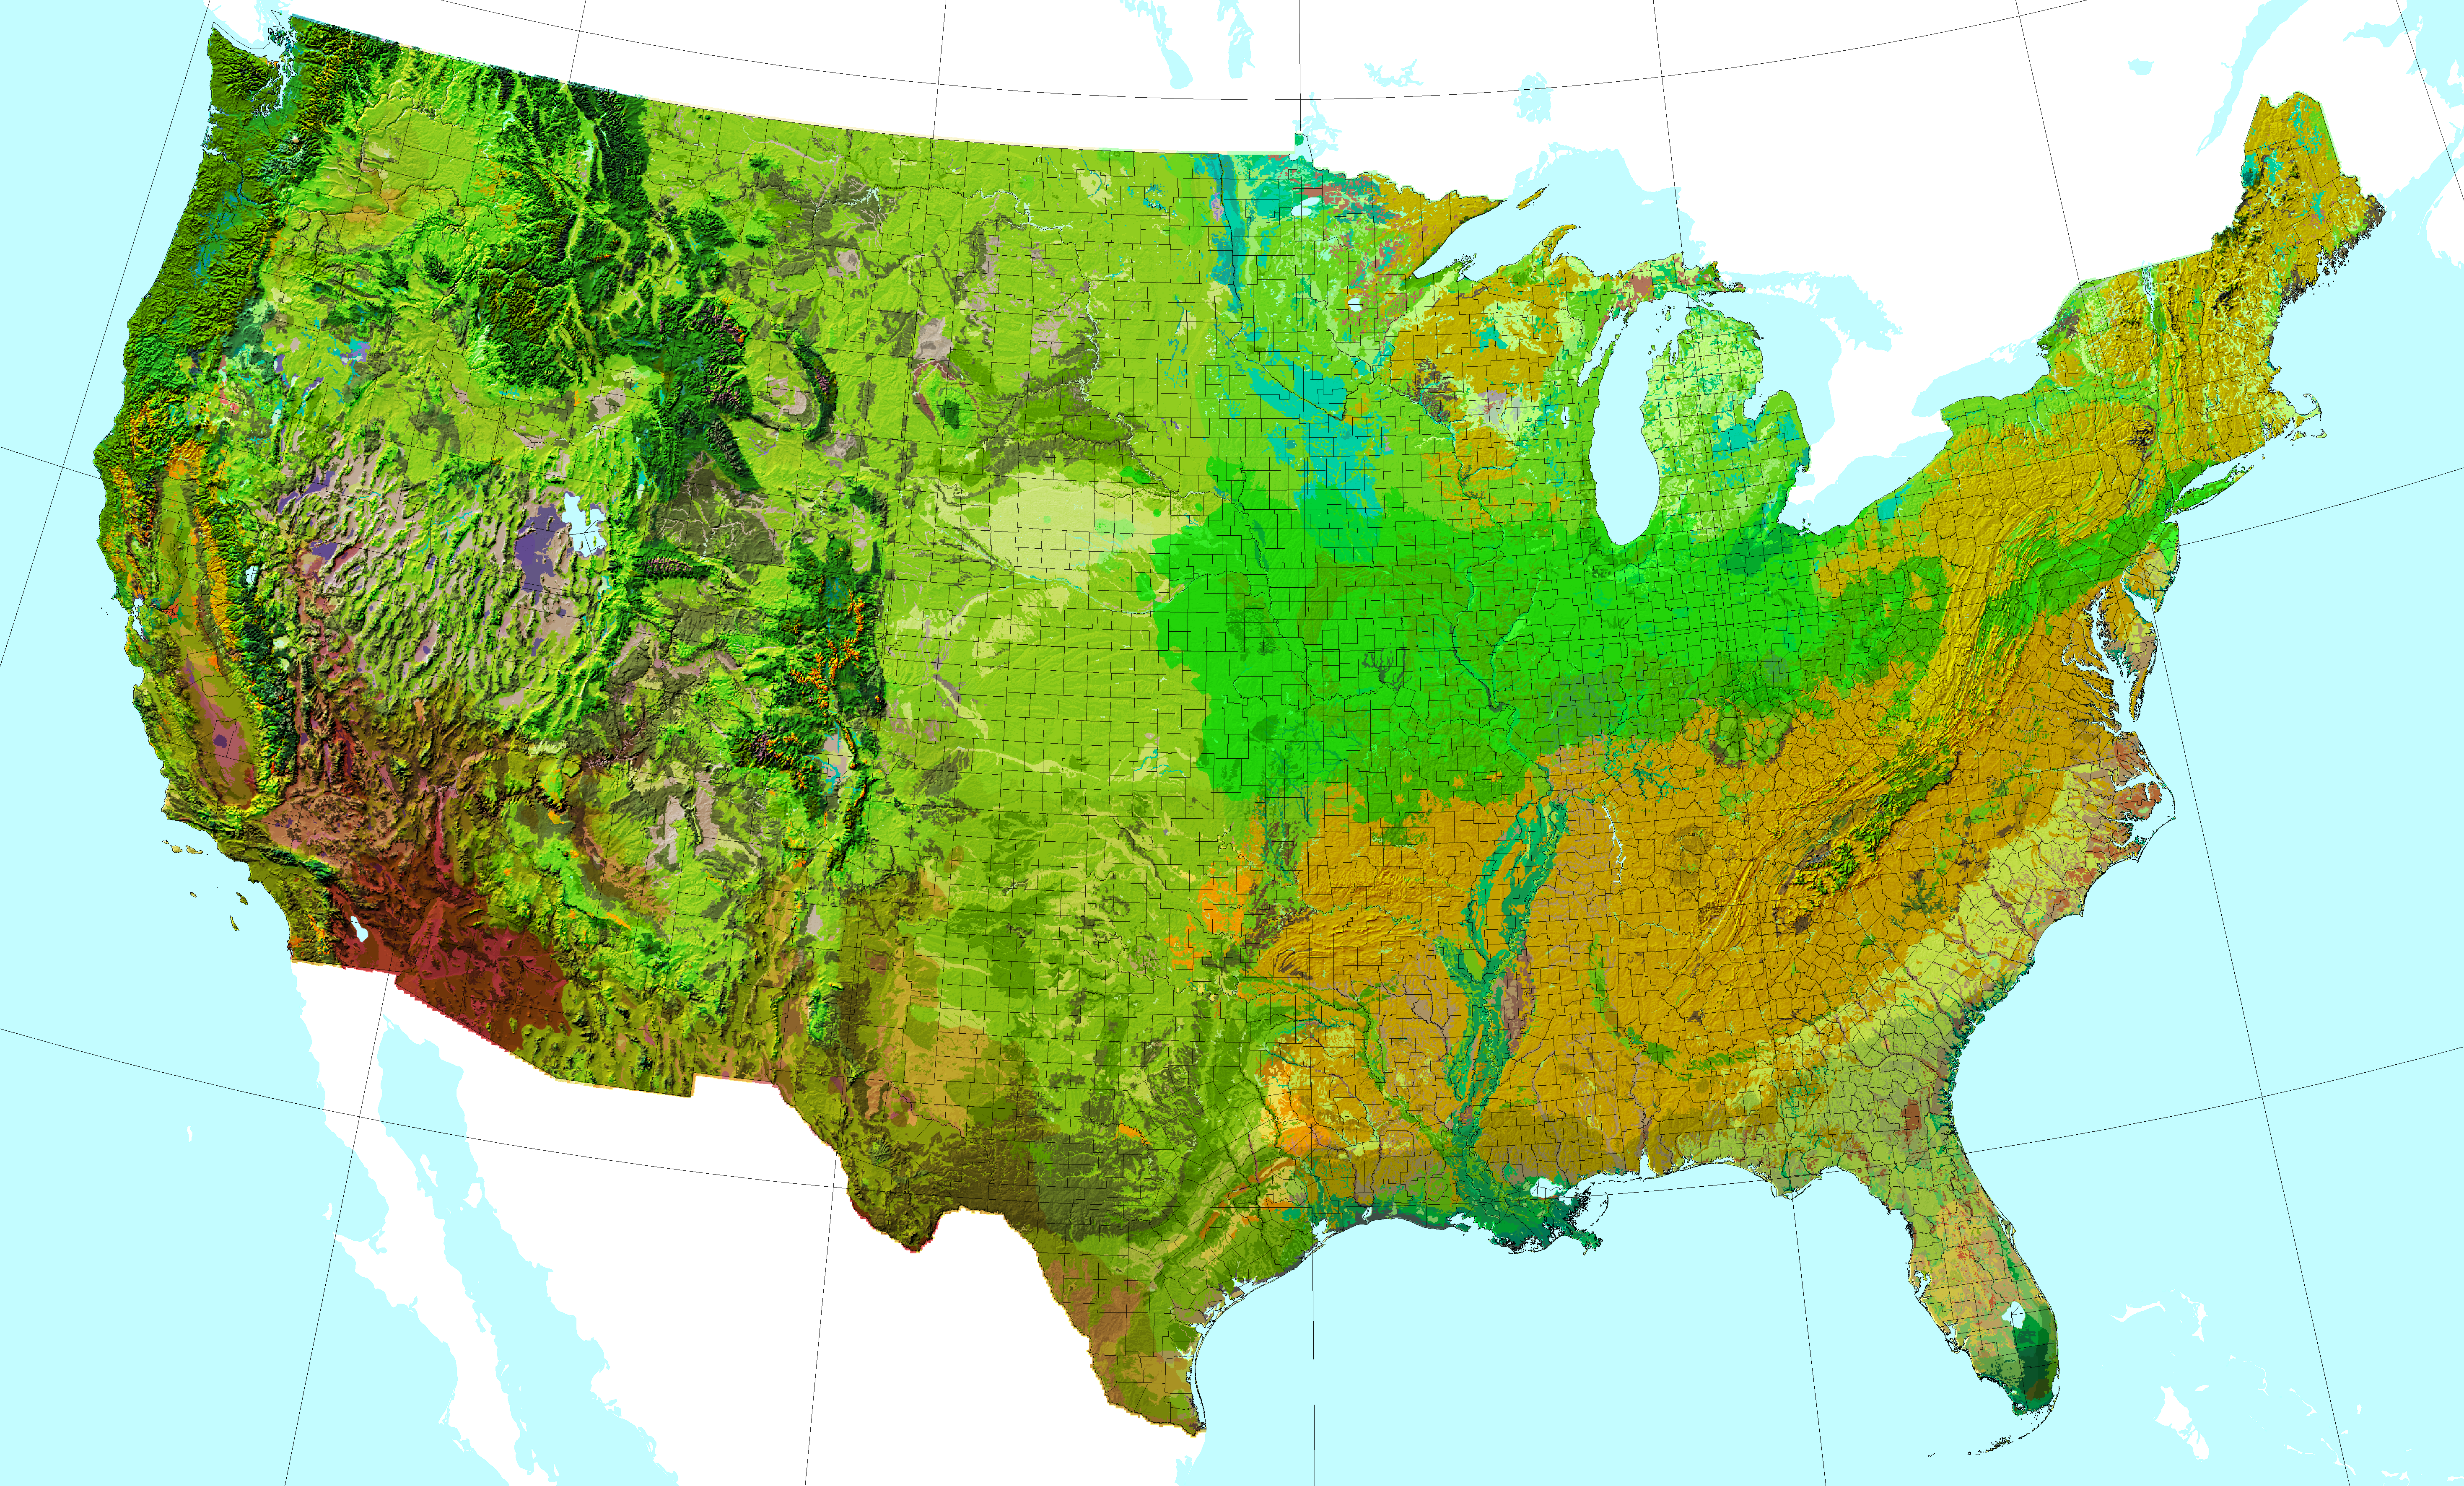
Composite map of climate, soil texture, wetlands, soil pH, and
topography.
©BONAP
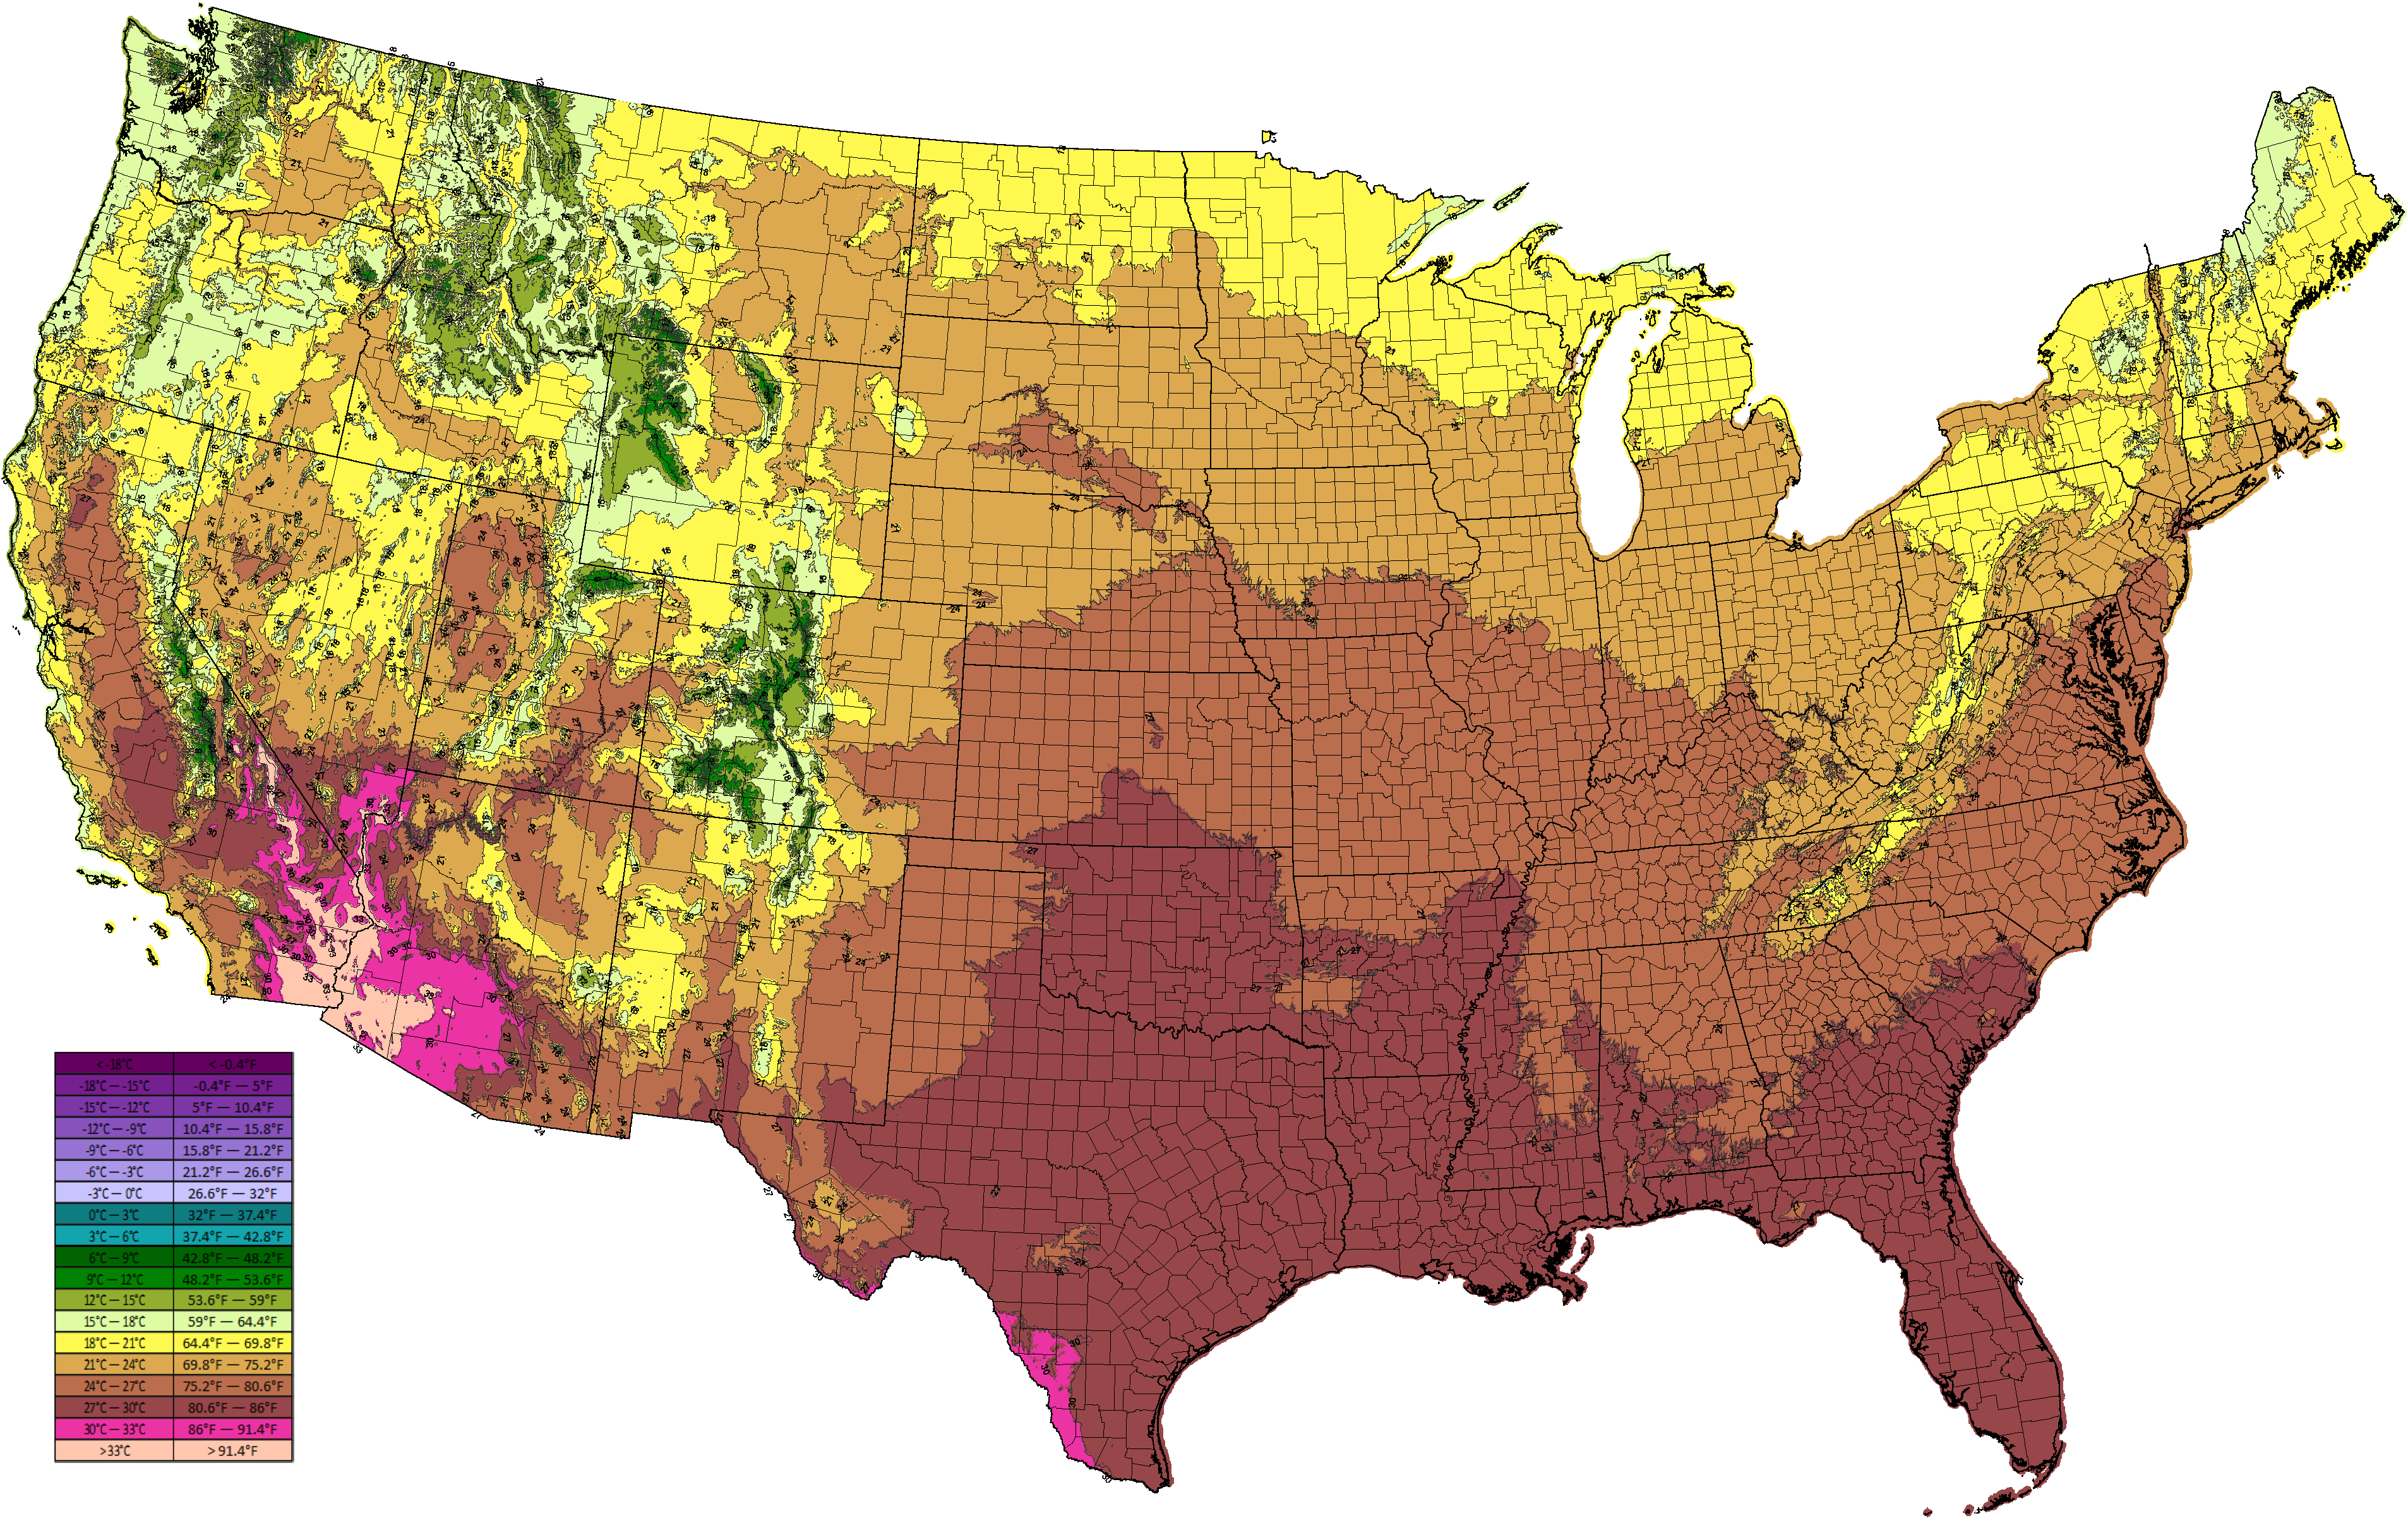
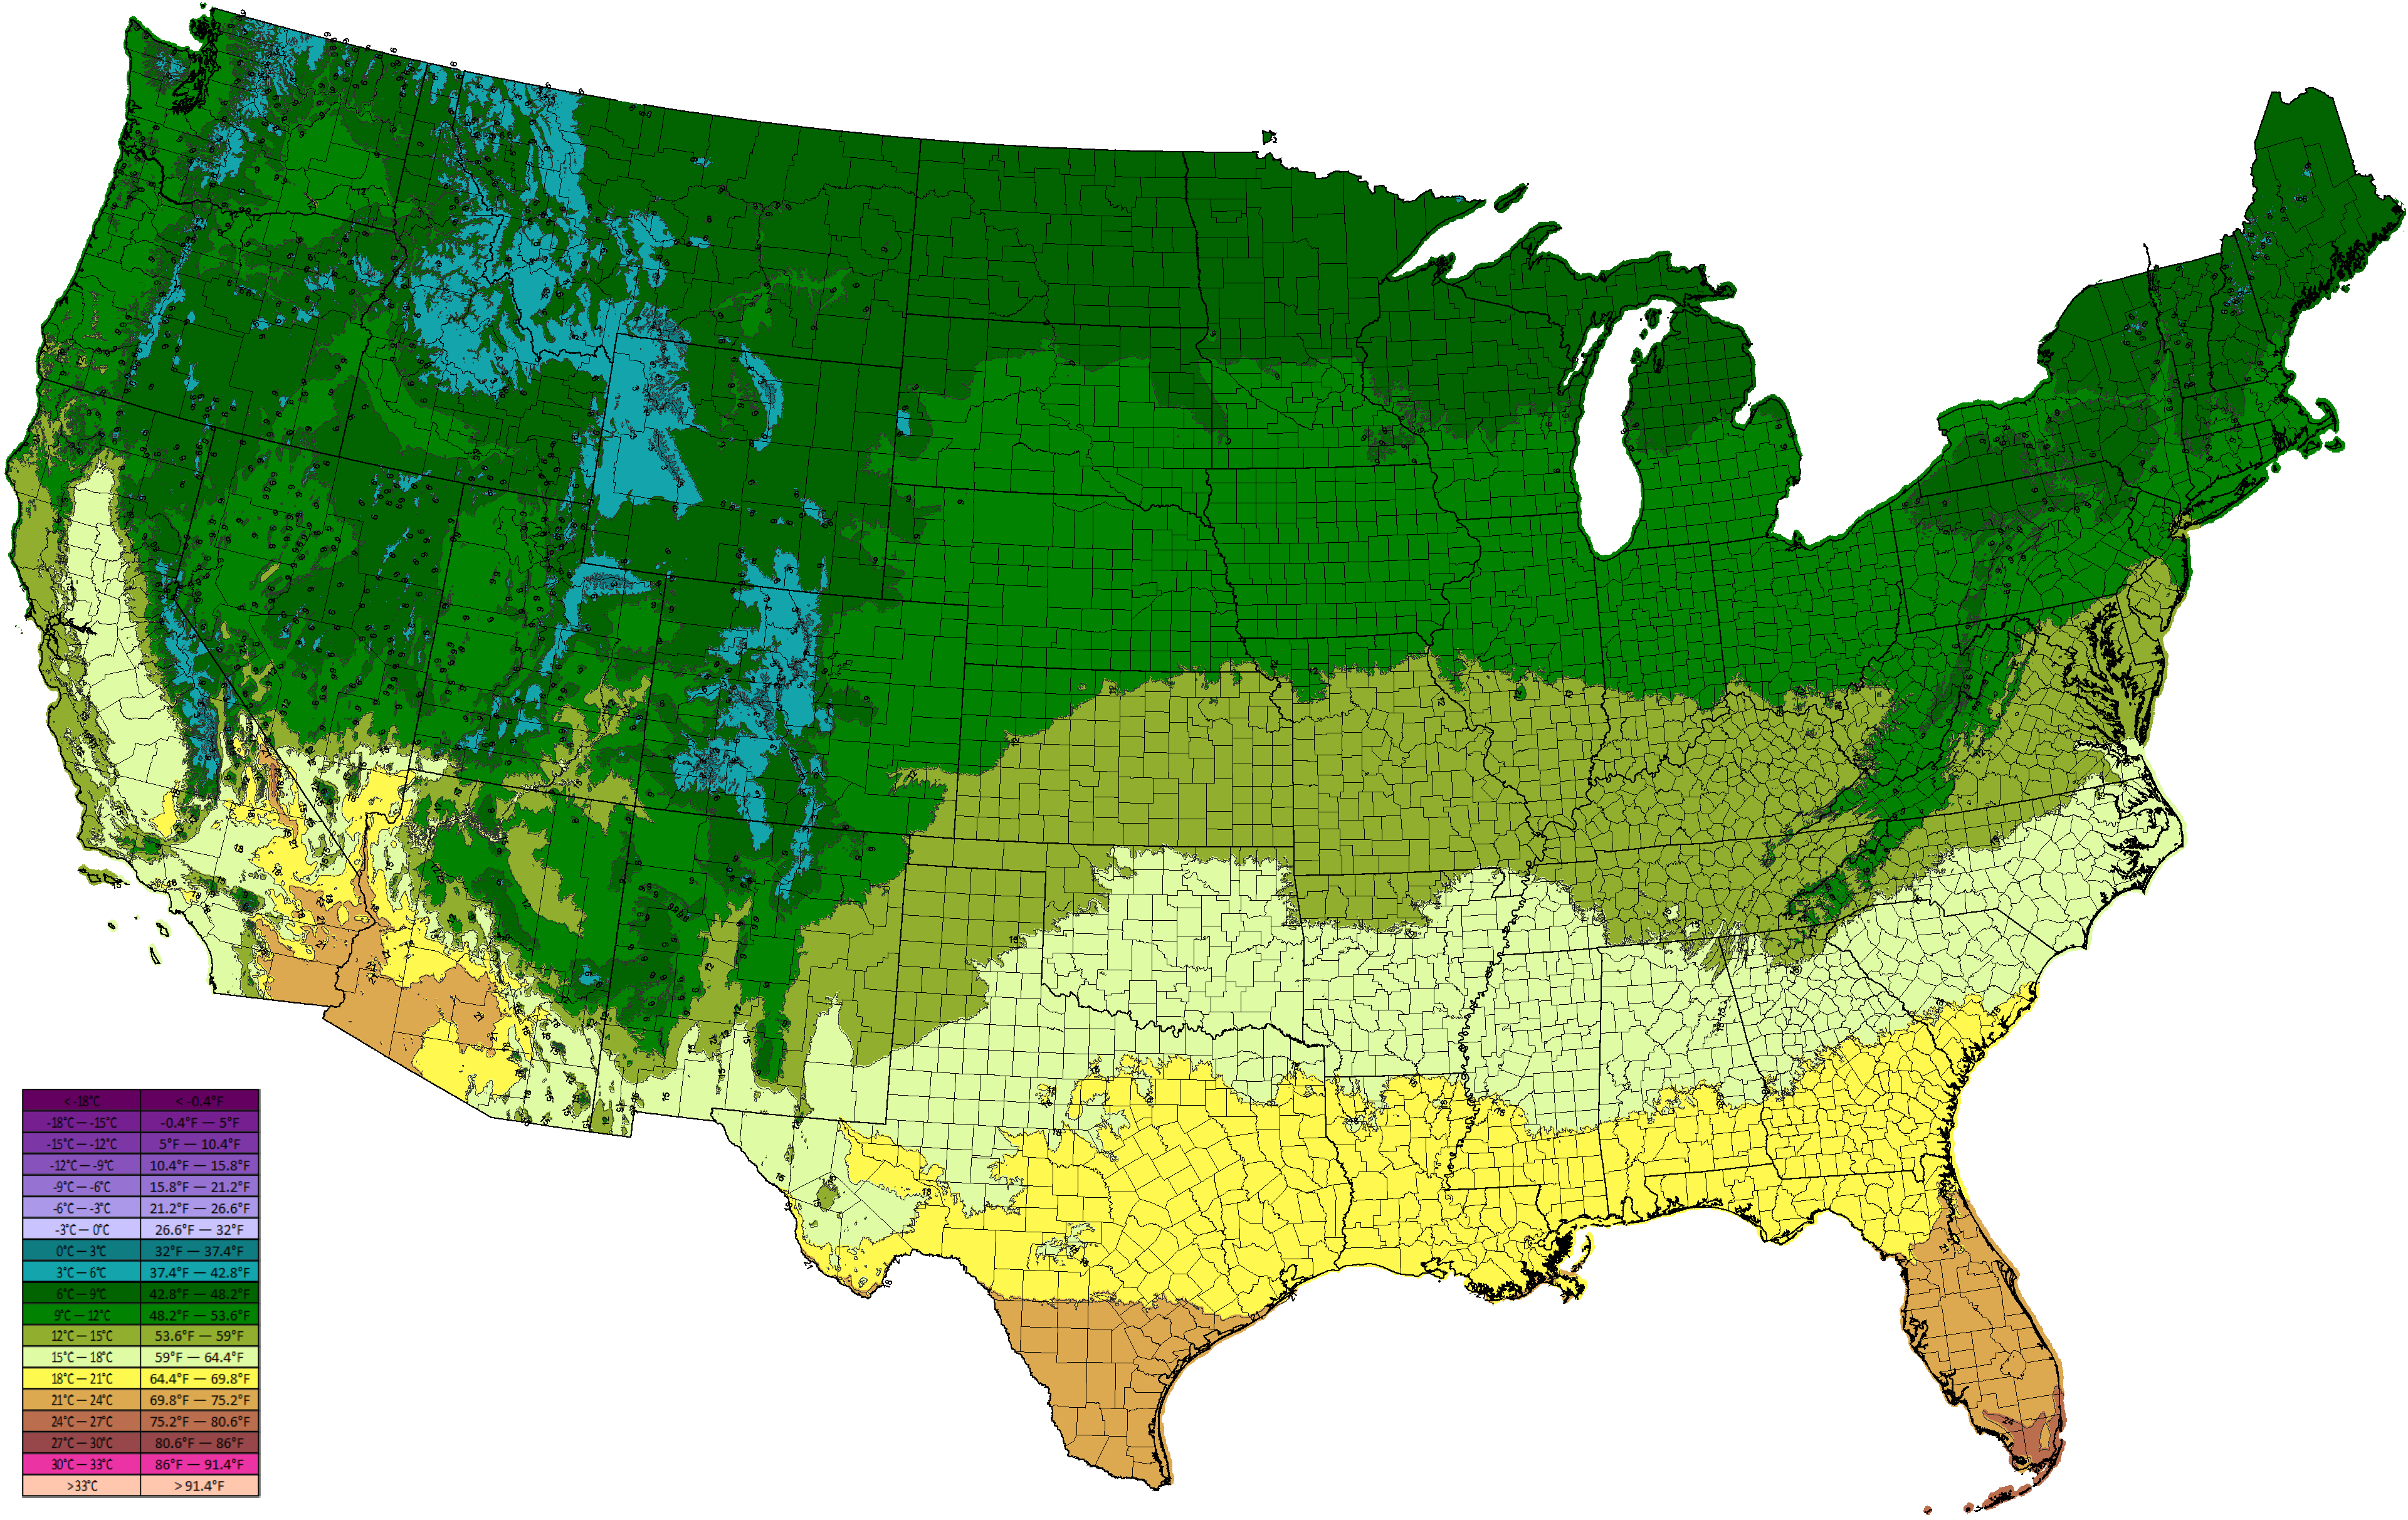
Average temperature of warmest month (July) in °C (Data from
PRISM, based on 1971-2000 climate normals) ©BONAP
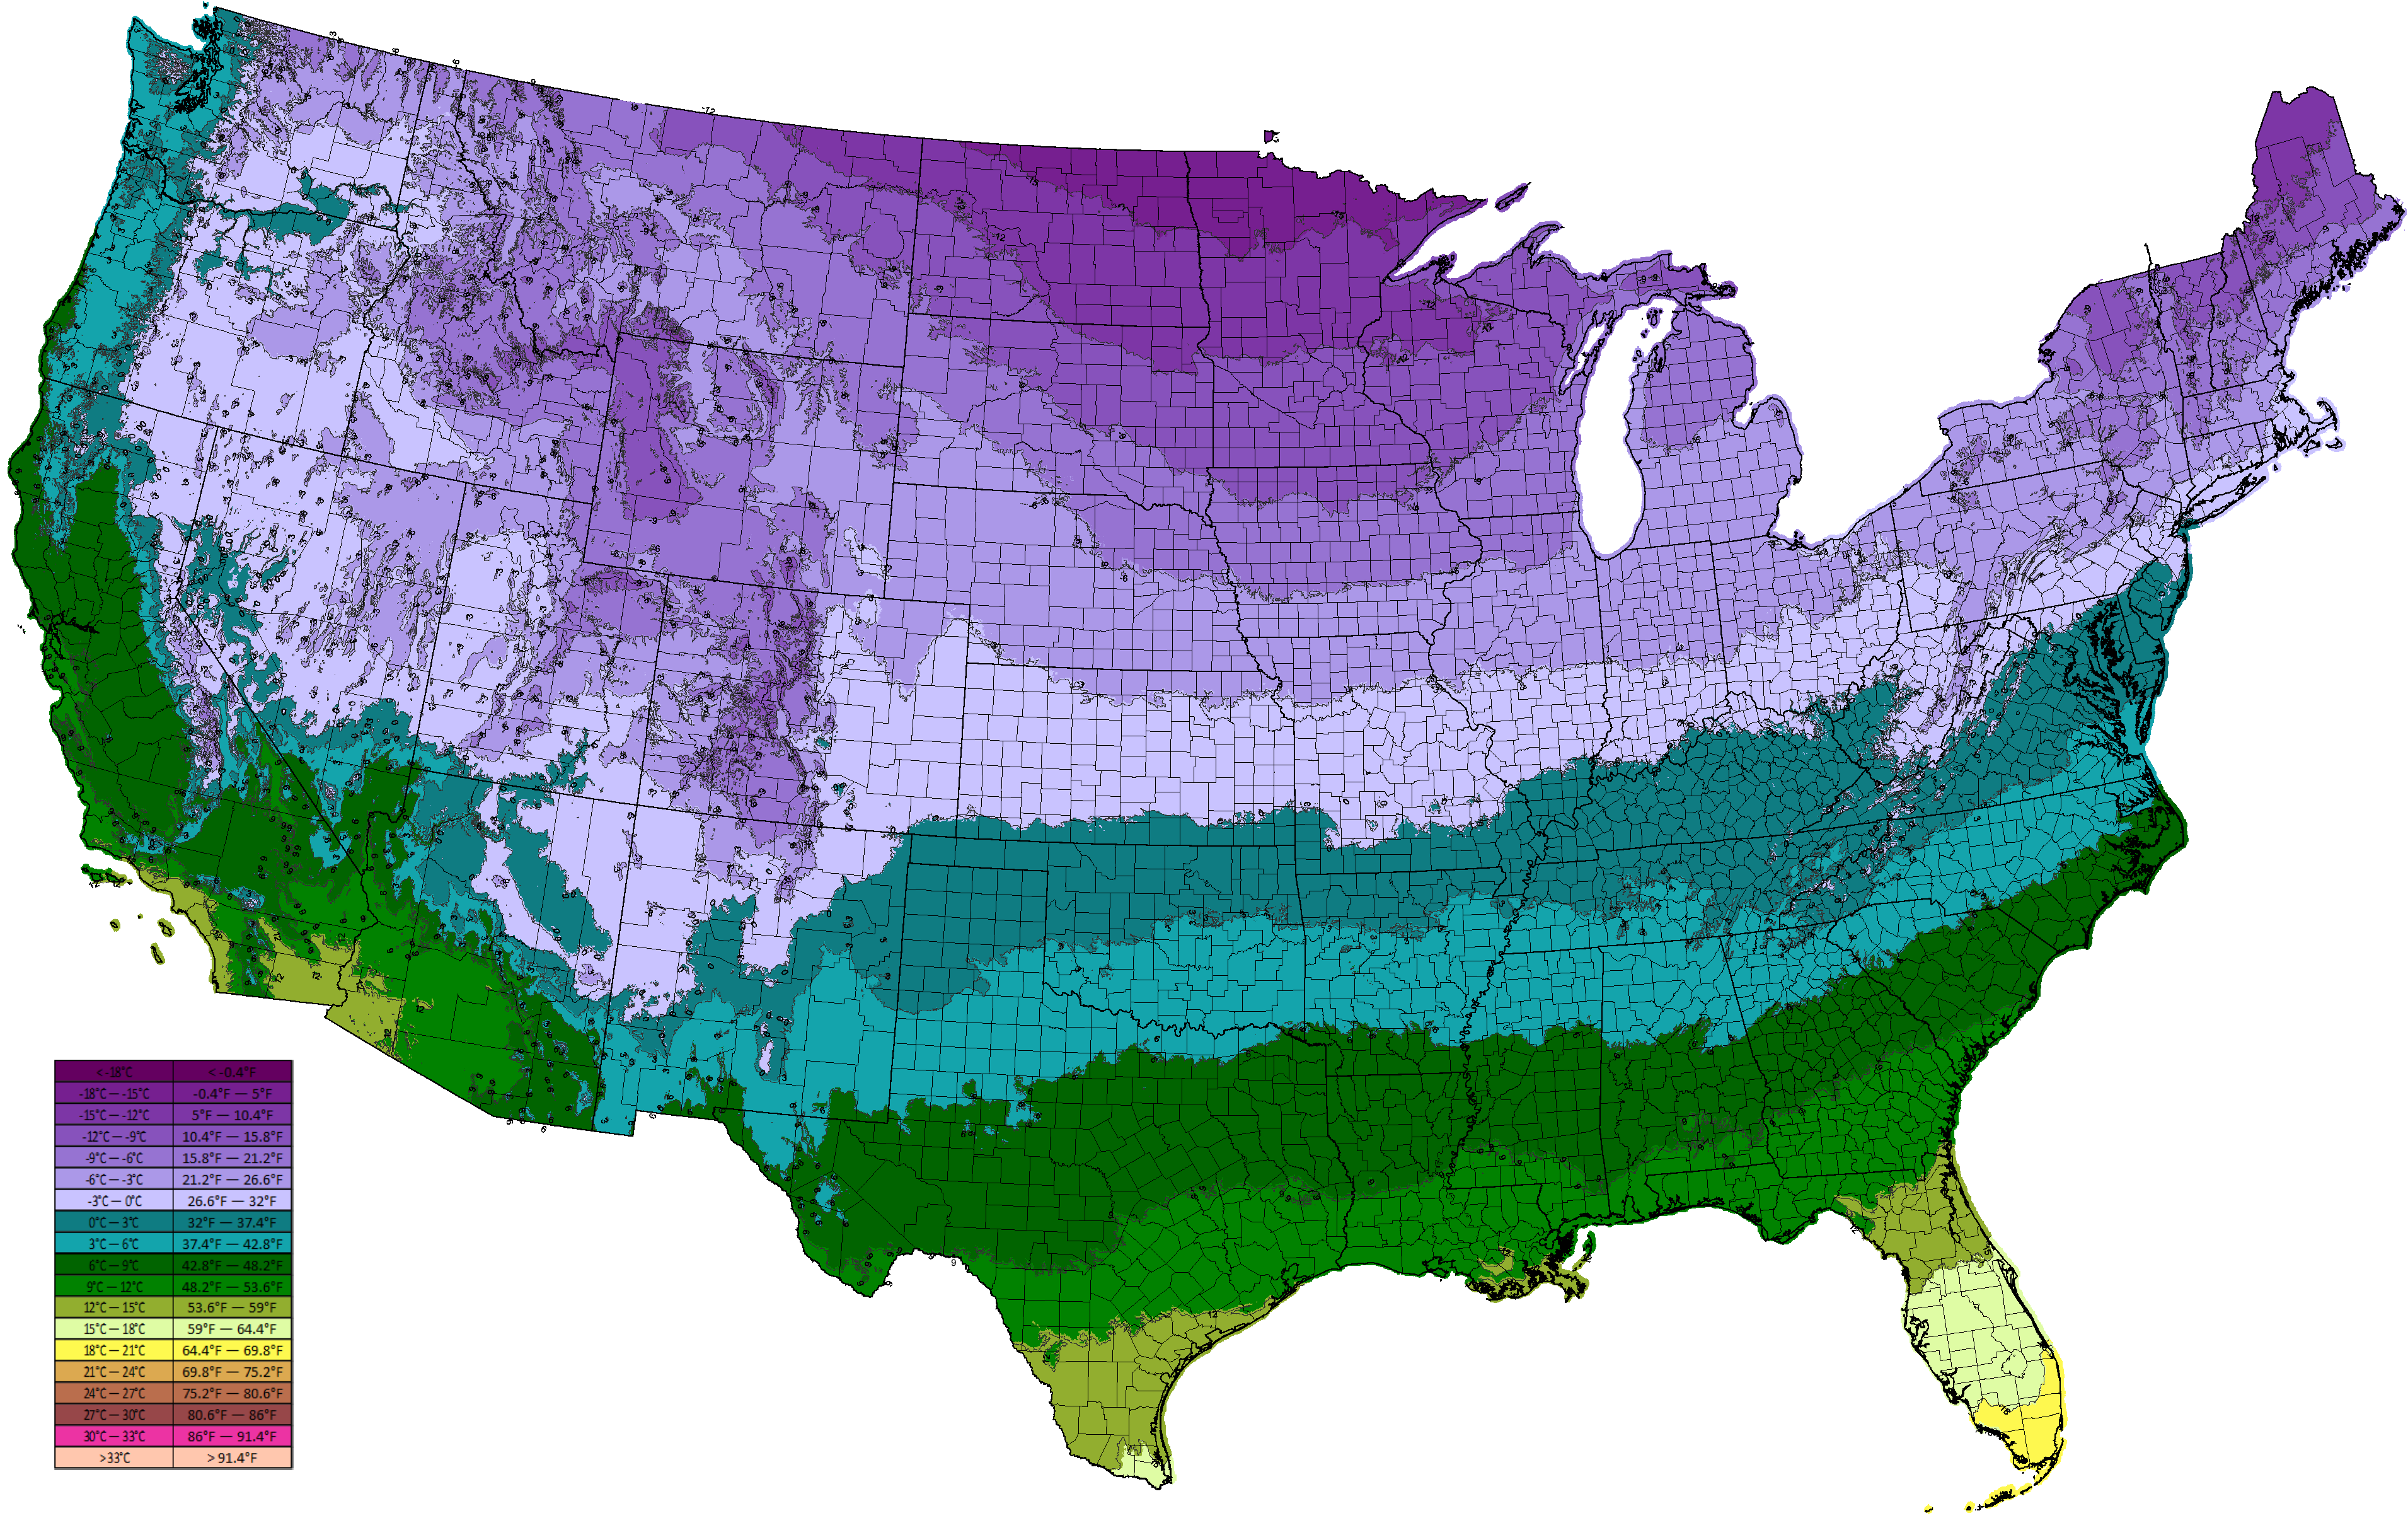
Average temperature of coldest month (January) in °C (Data from
PRISM, based on 1971-2000 climate normals) ©BONAP
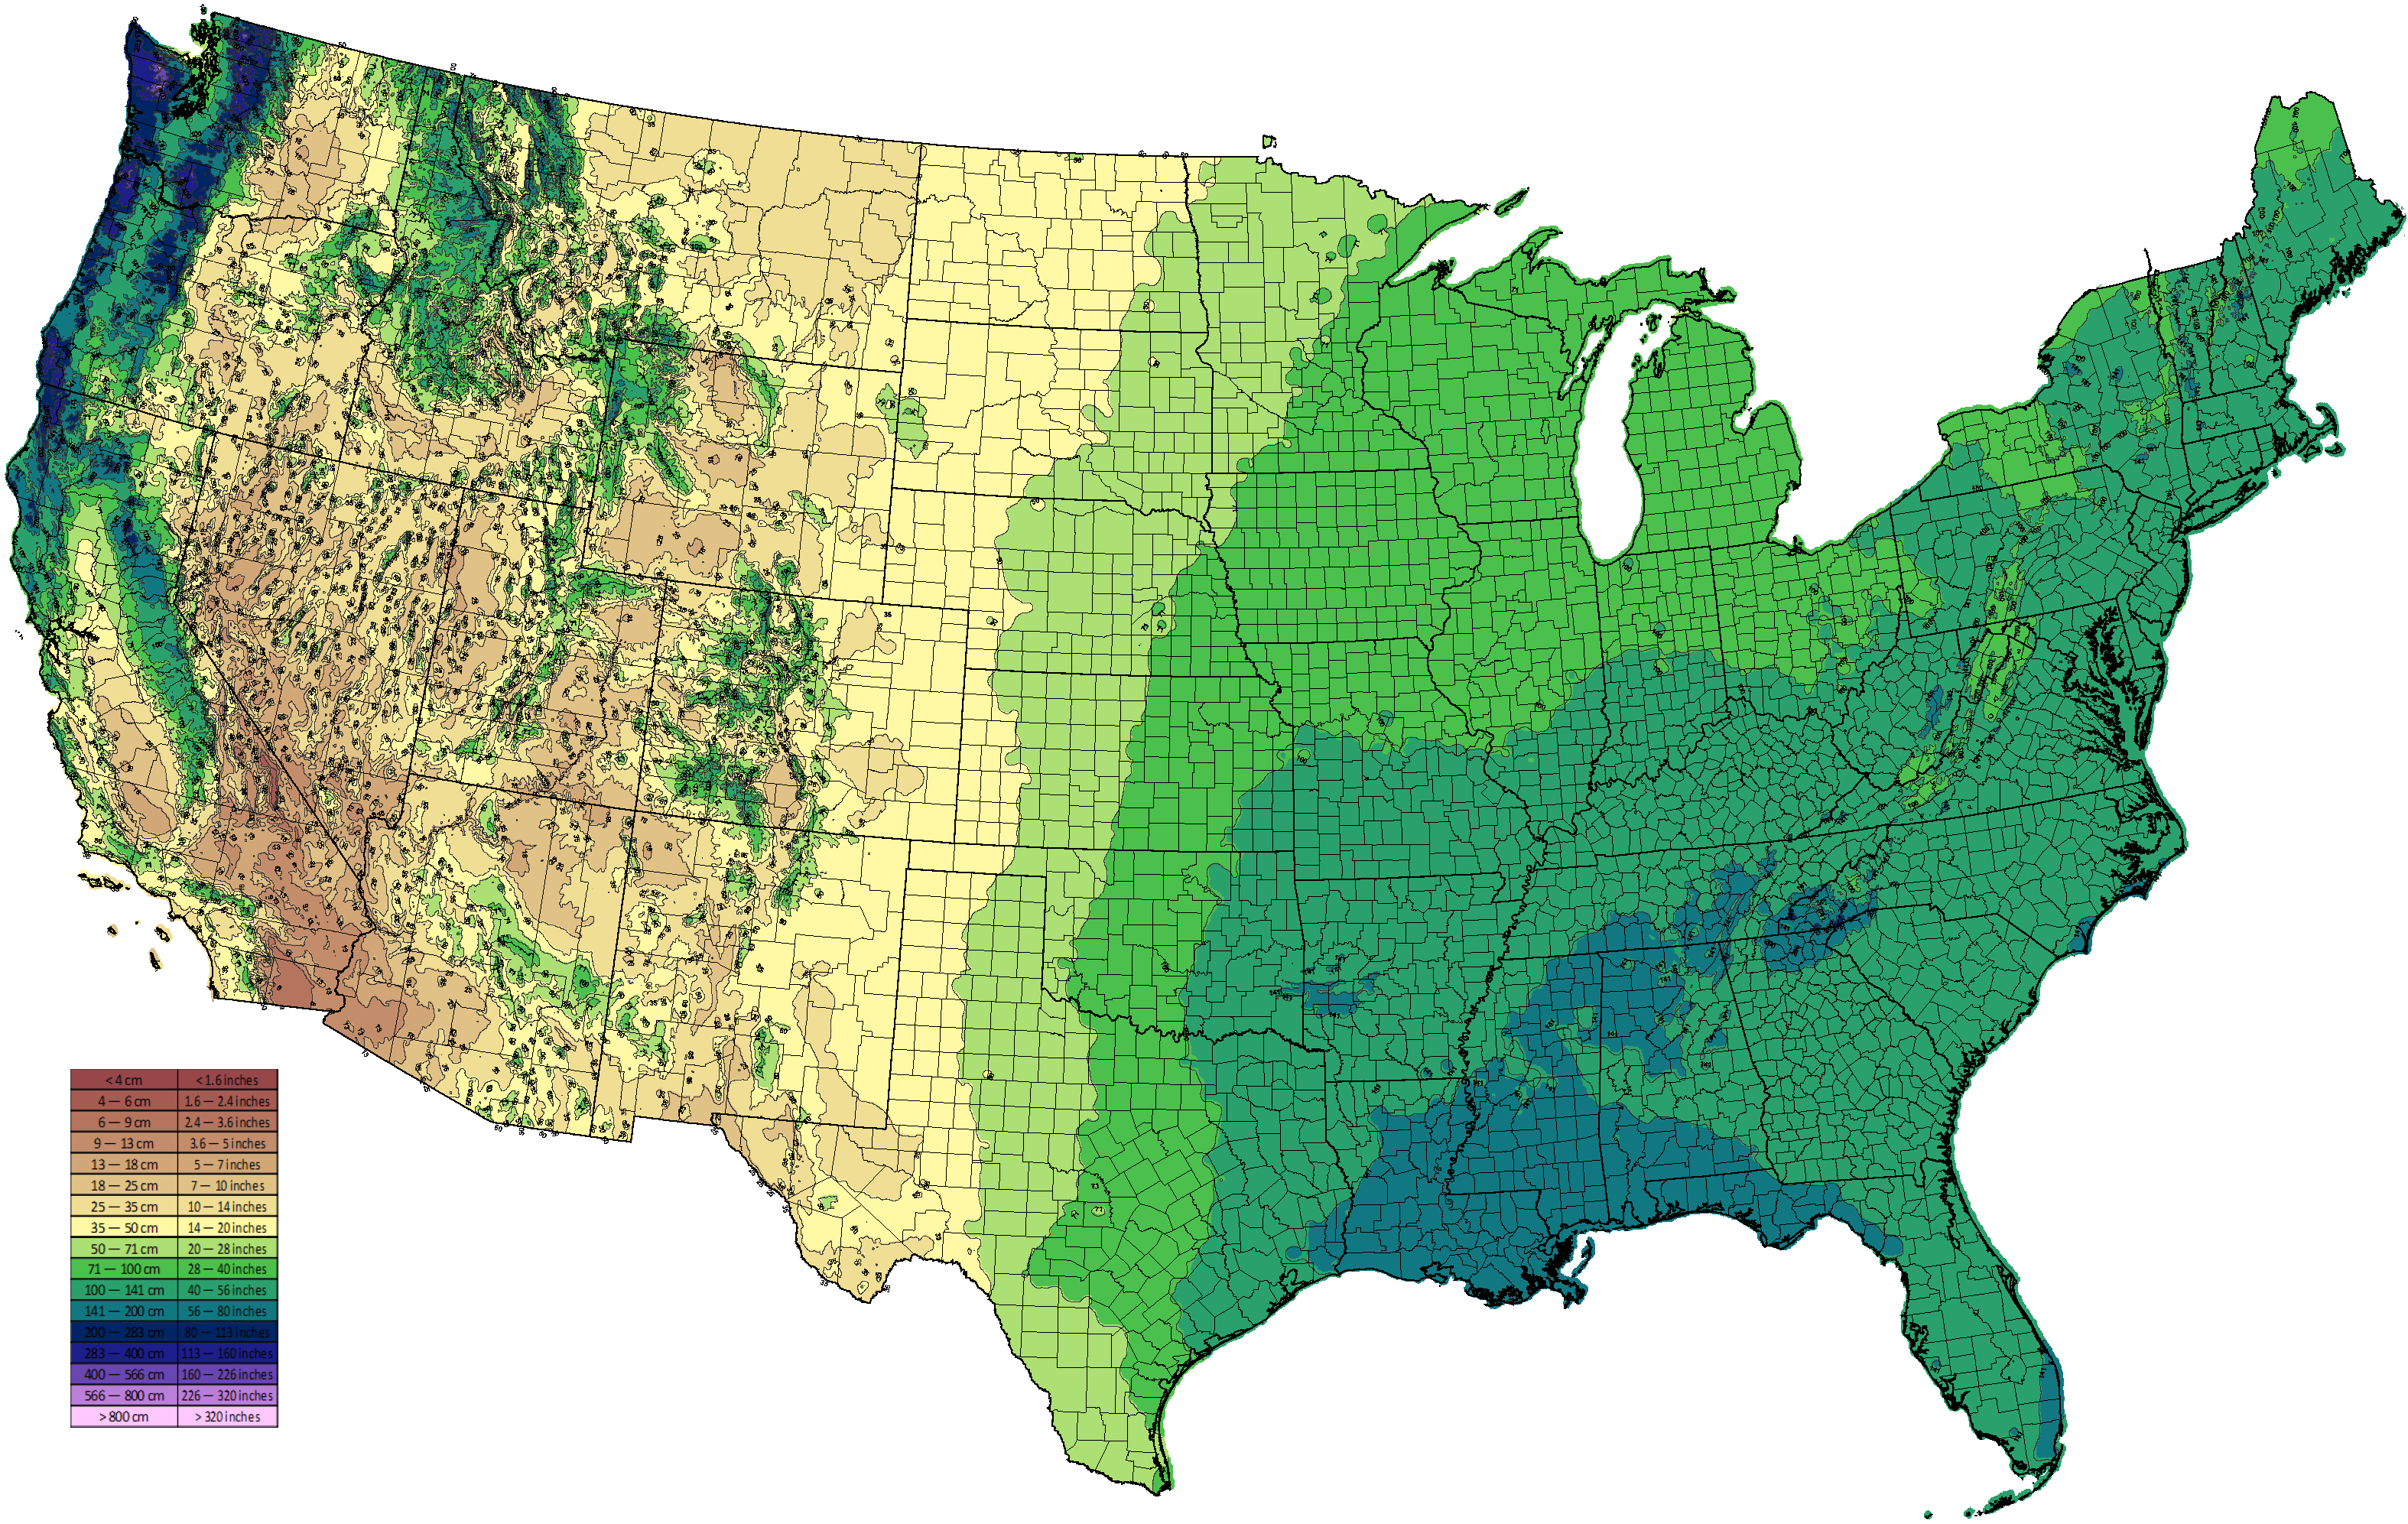
Annual precipitation in centimeters (Data from PRISM, based on
1971-2000 climate normals) ©BONAP
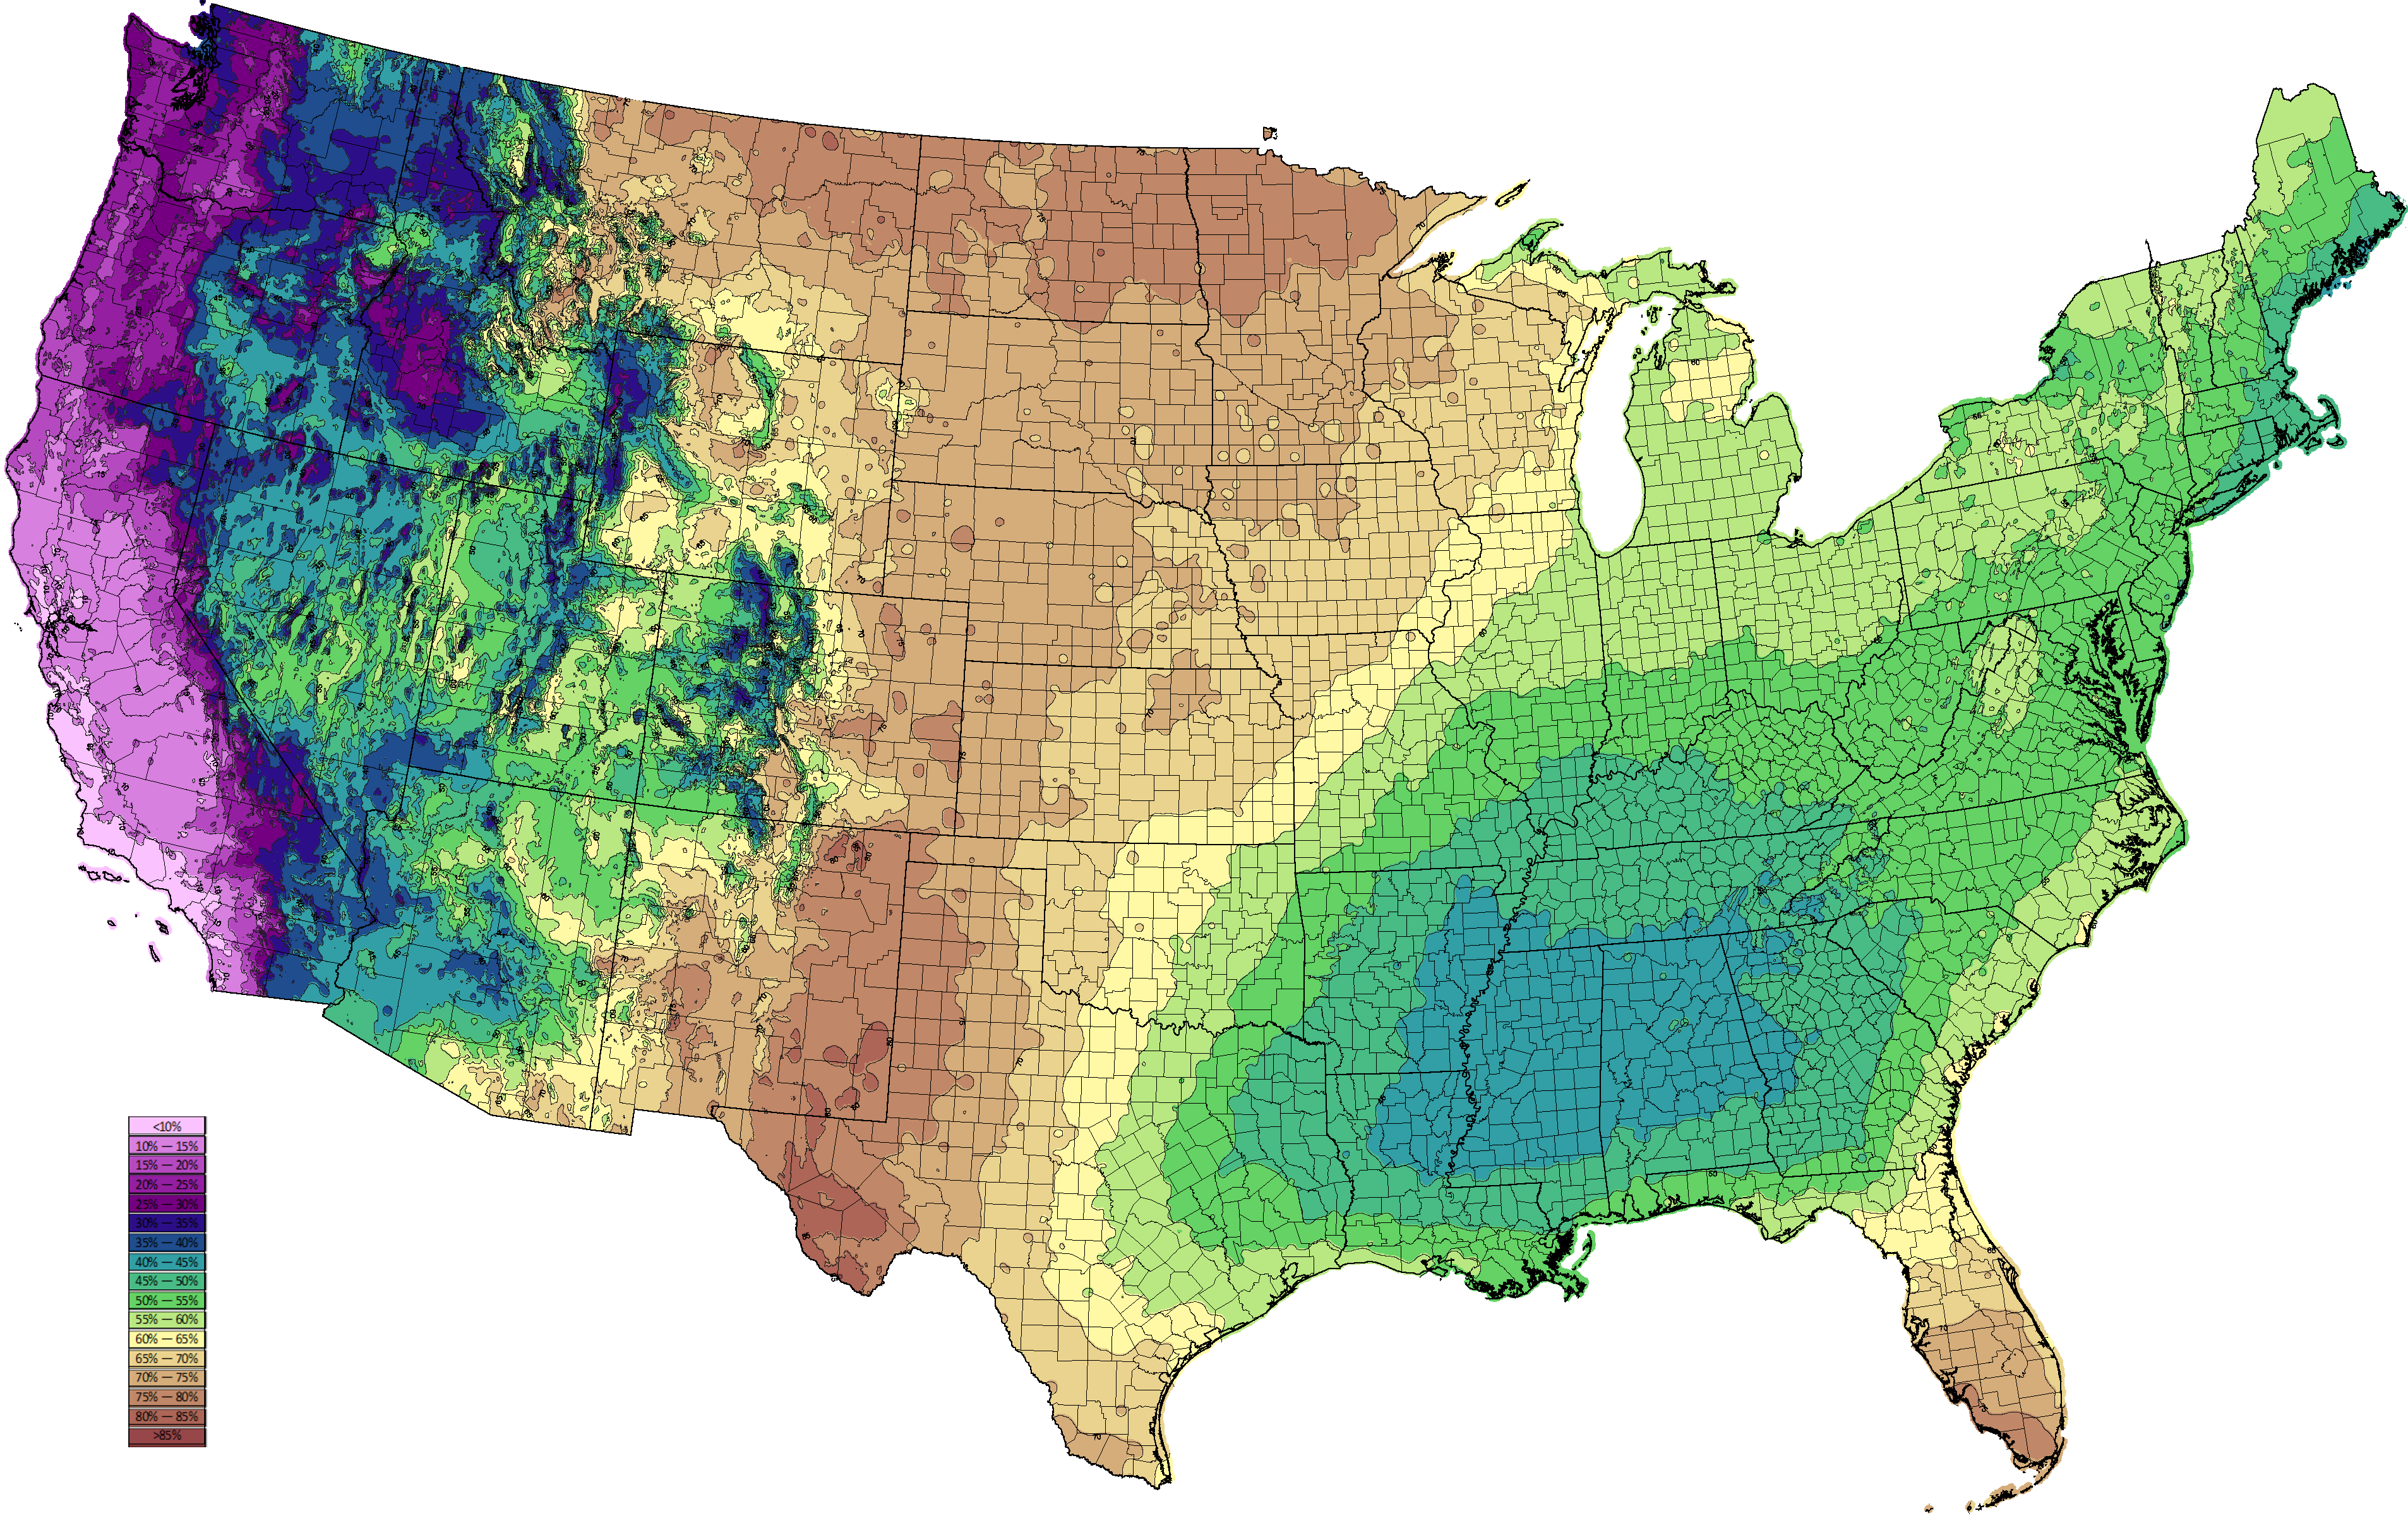
Percent of annual precipitation falling May-October, the warmest
6 months of the yearData from PRISM, based on 1971-2000
climate normals) ©BONAP
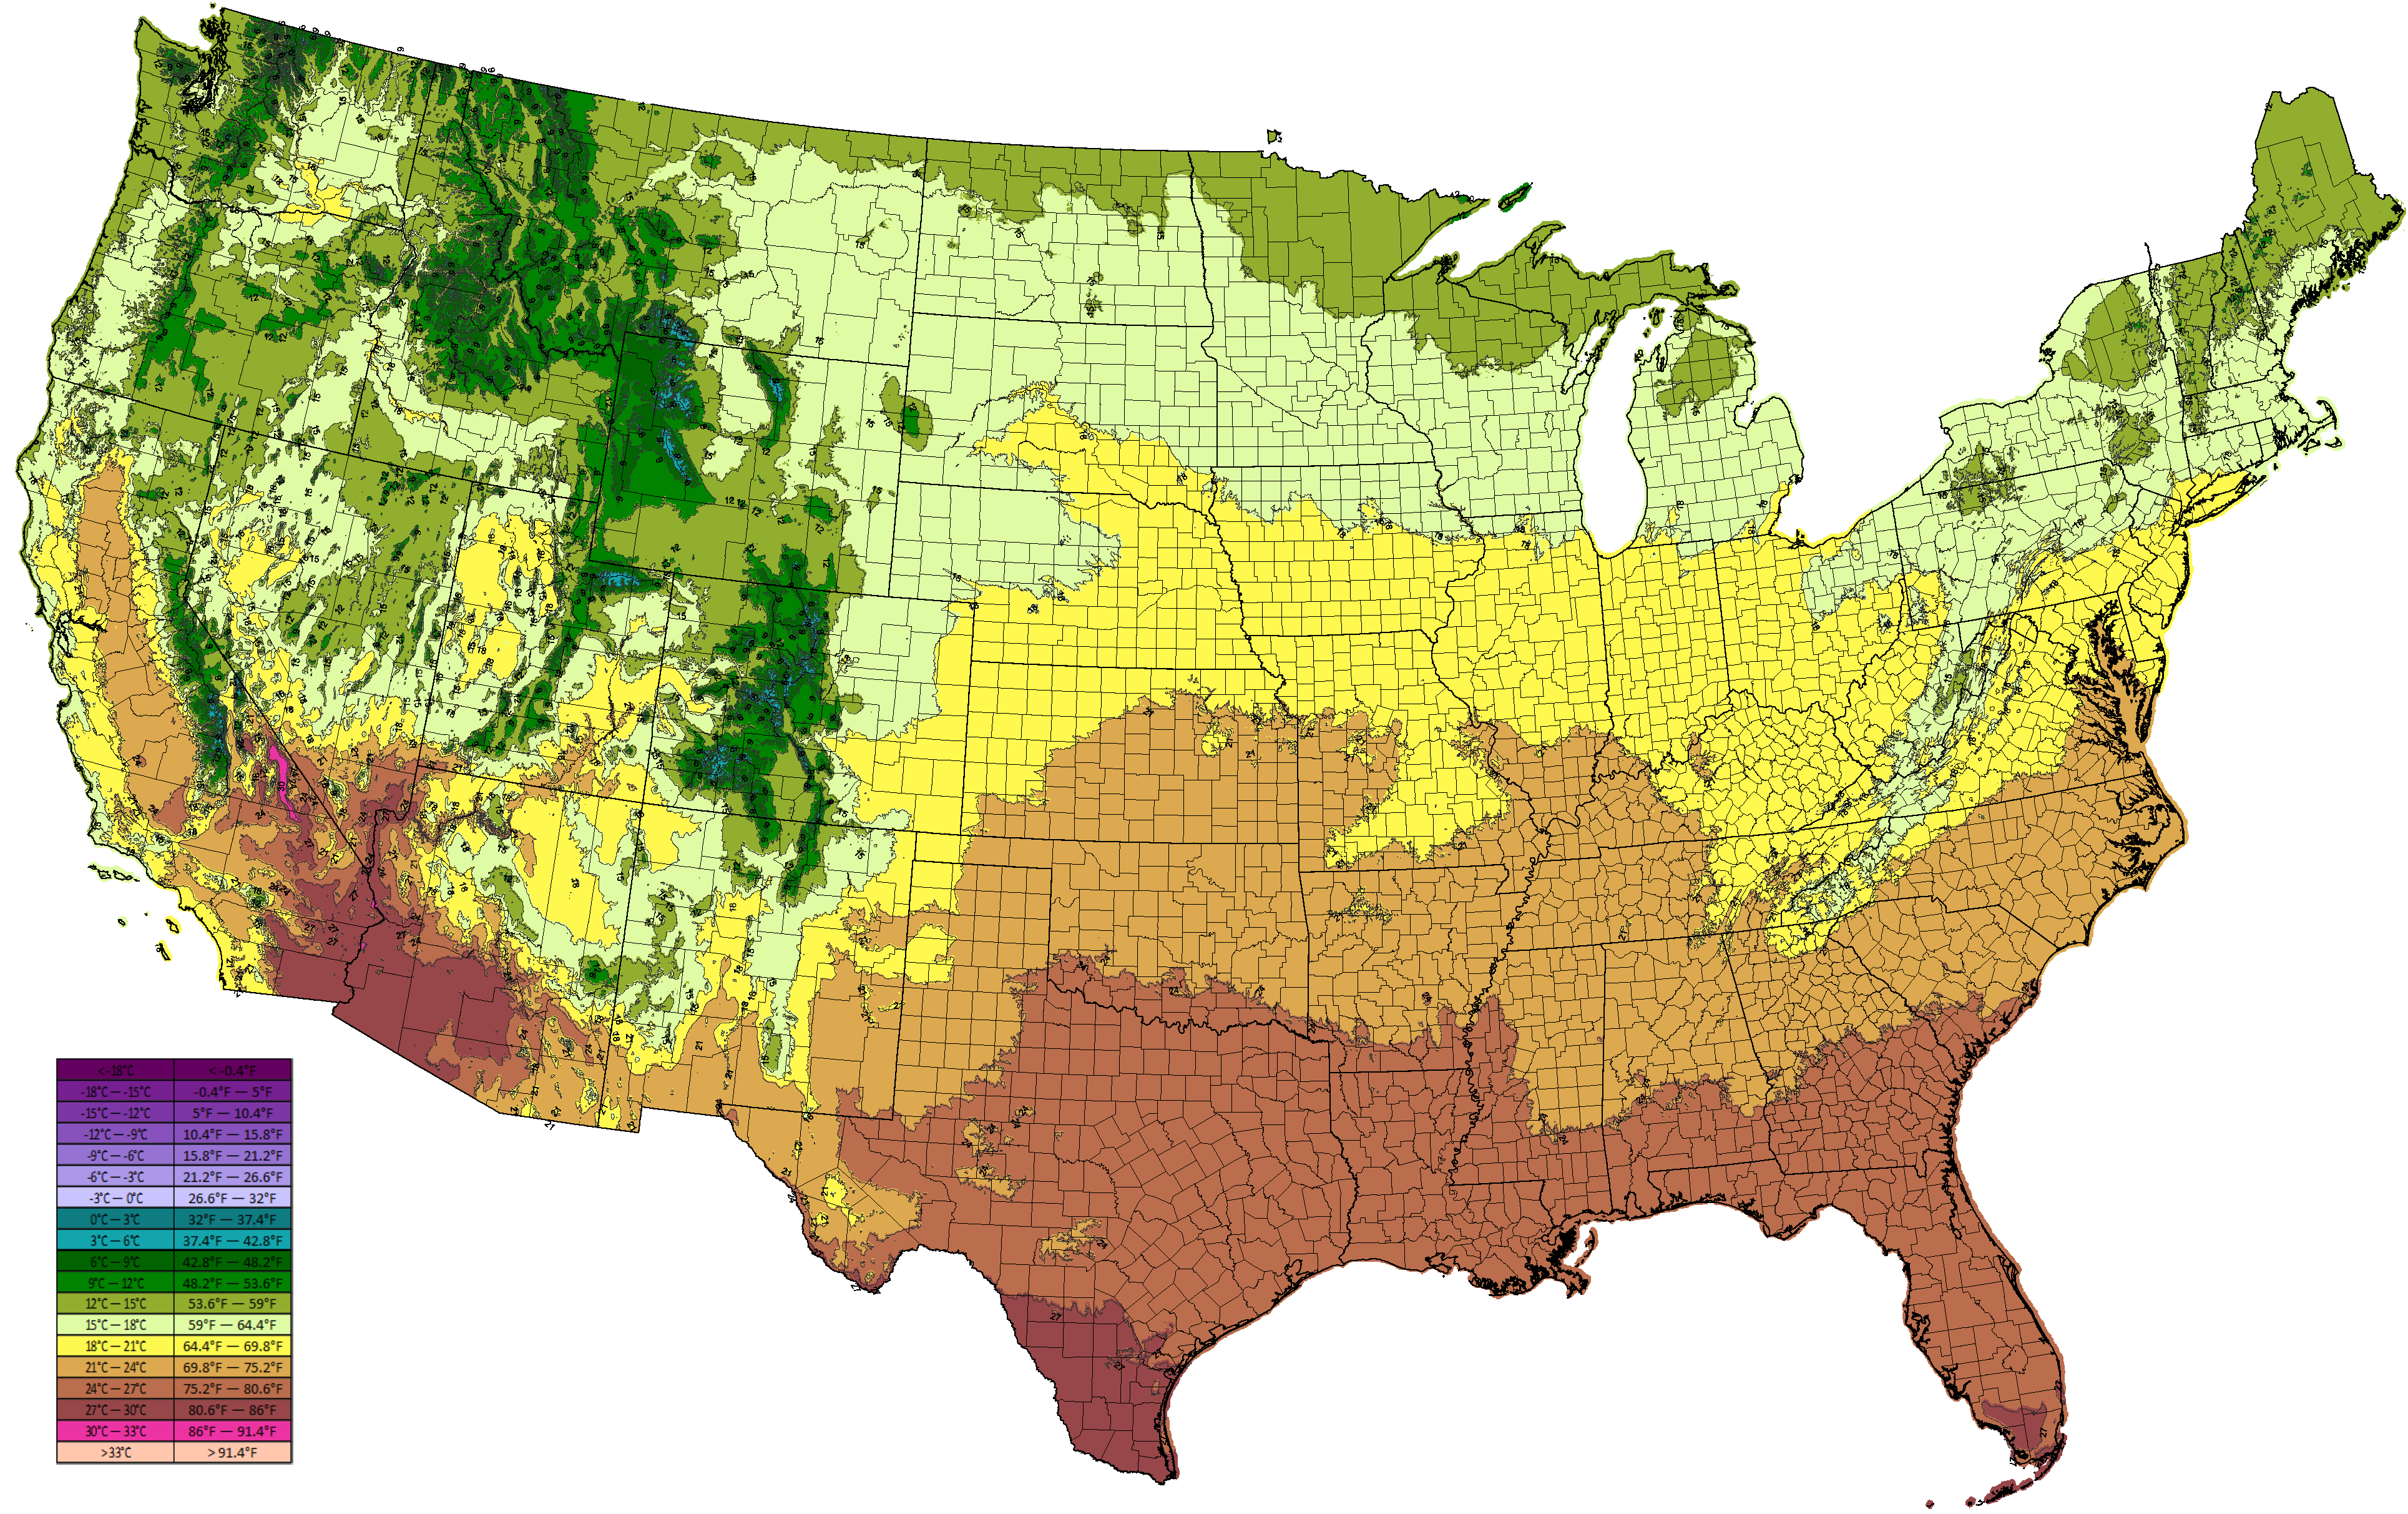
Warmth index (positive temperature averages for the warmest 6
months; i.e. May – October averaged, whereby monthly
temperatures less than 0°C are assumed zero)
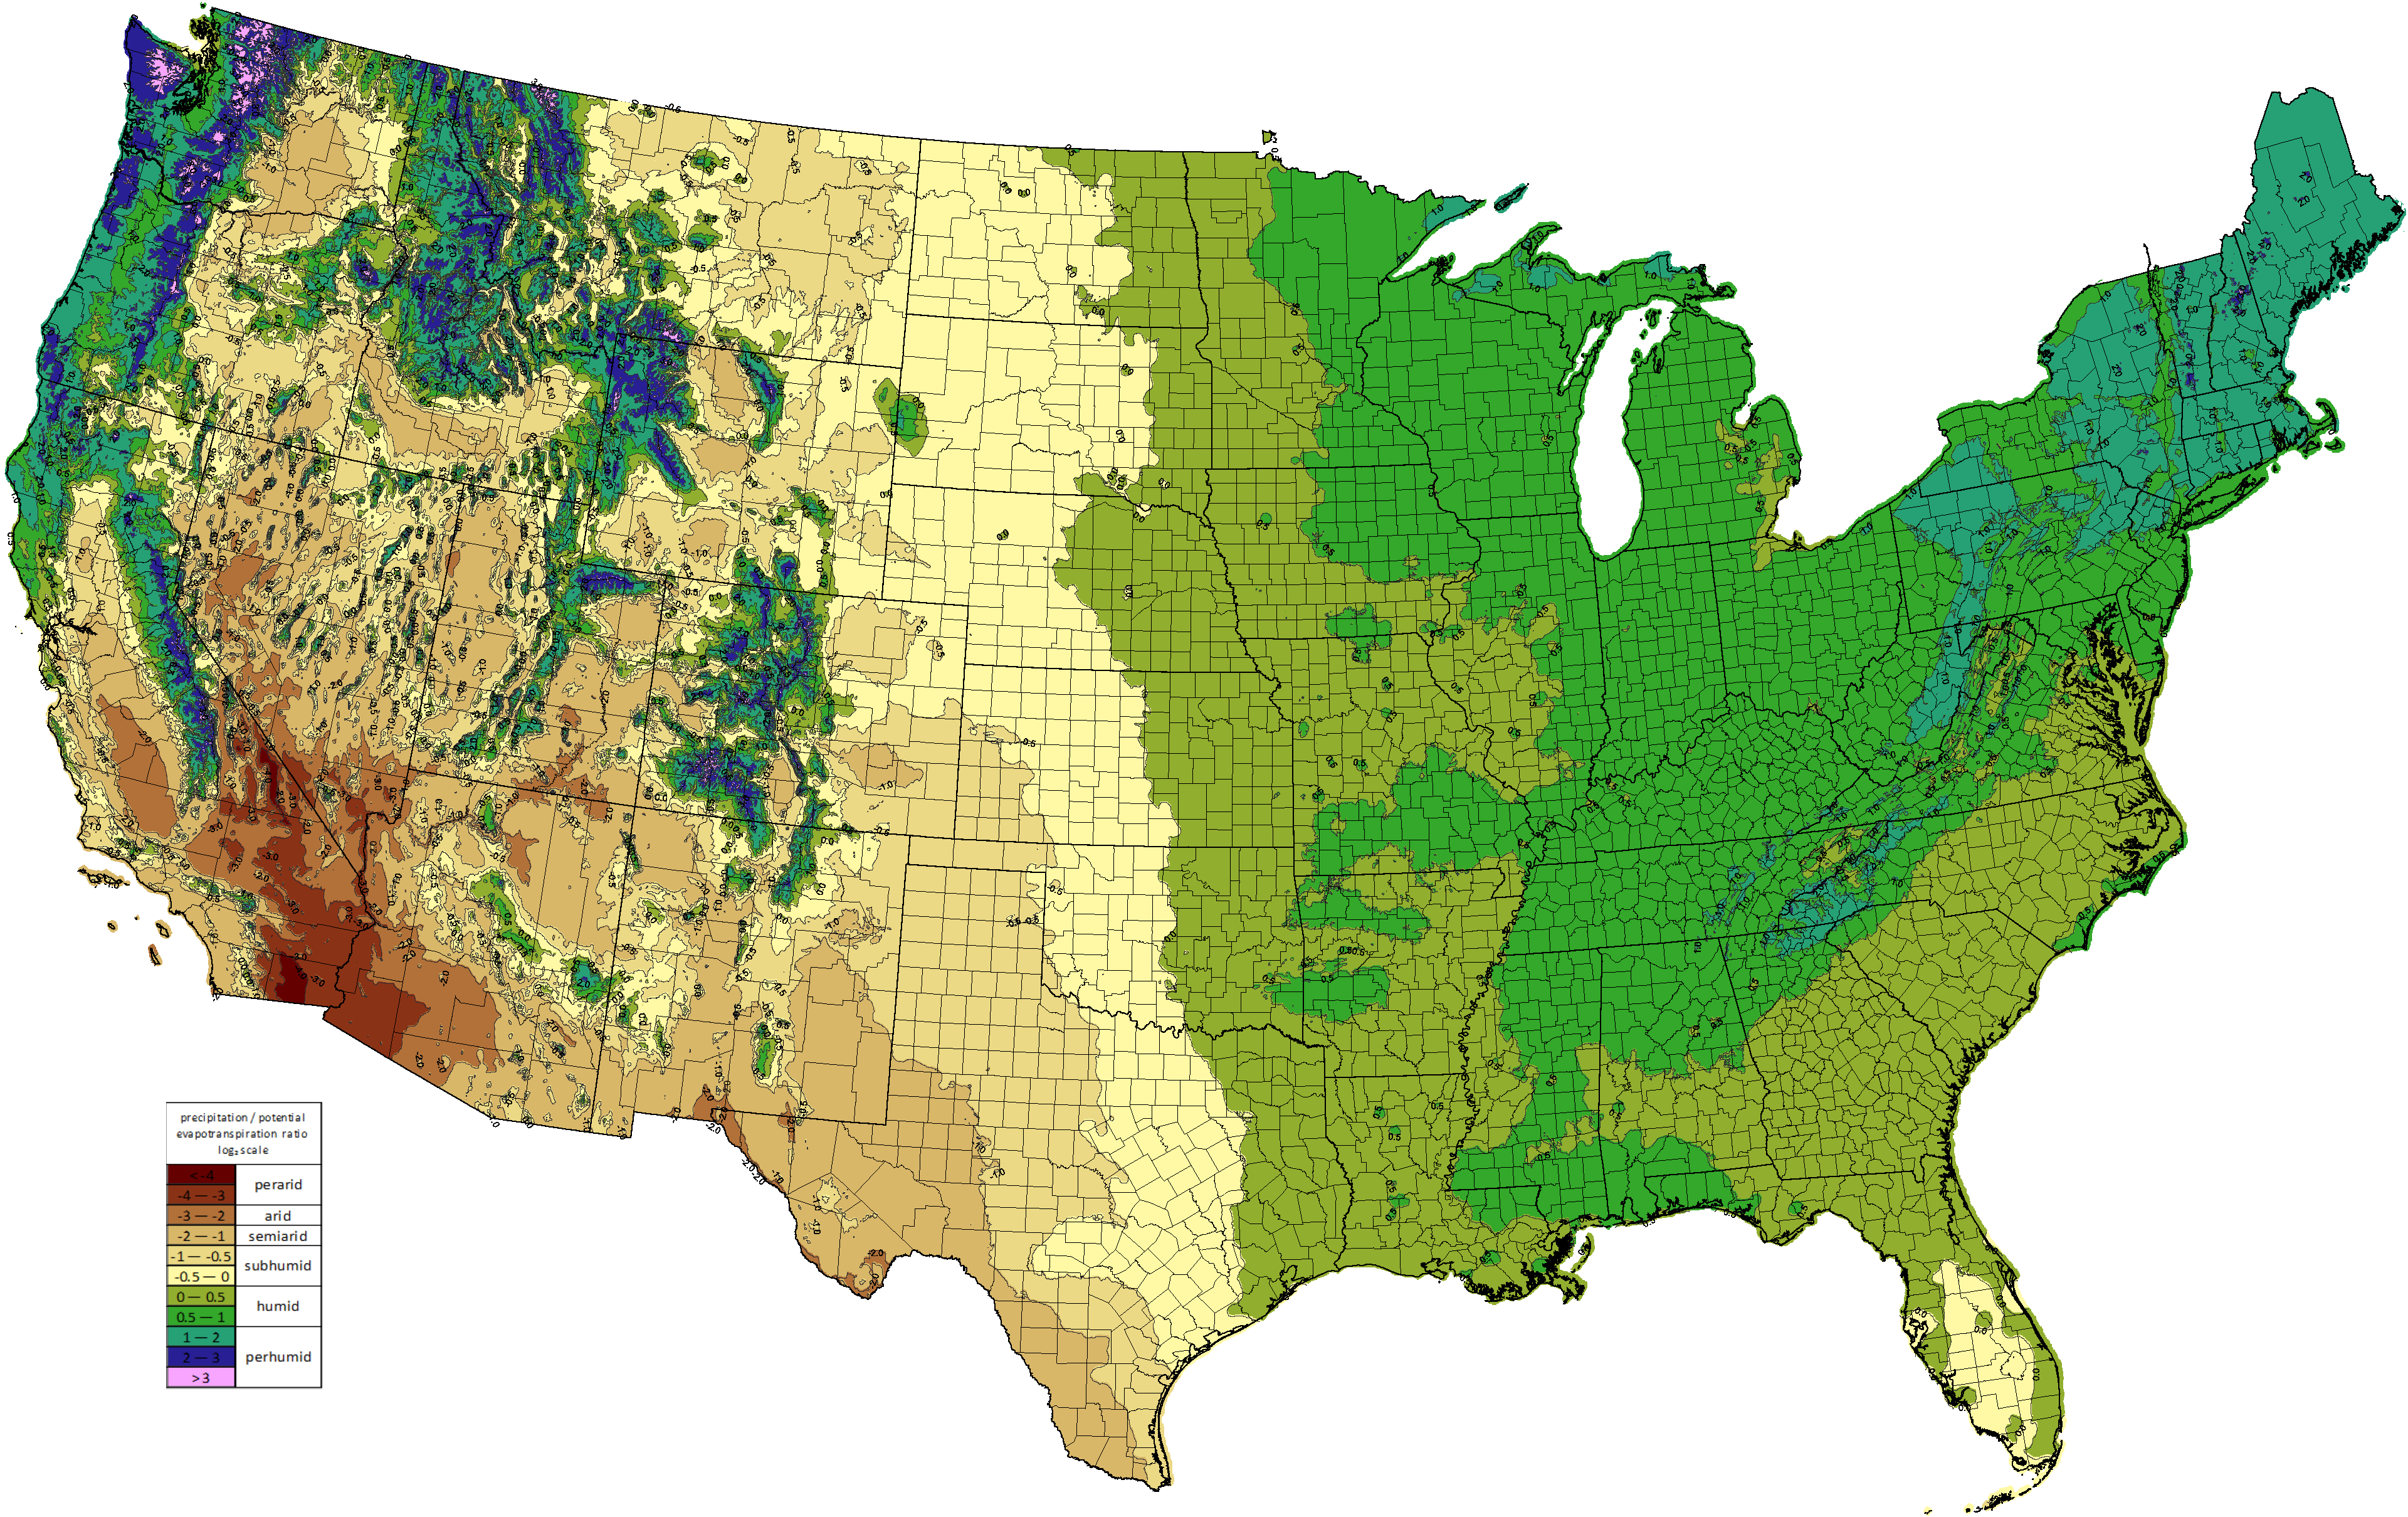
Moisture index (ratio of annual precipitation over annual
evapotranspiration, where evapotranspiration is estimated by
multiplying the annual positive temperature average, or
Holdridge biotemperature (annual positive temperature average
with no maximum limit)
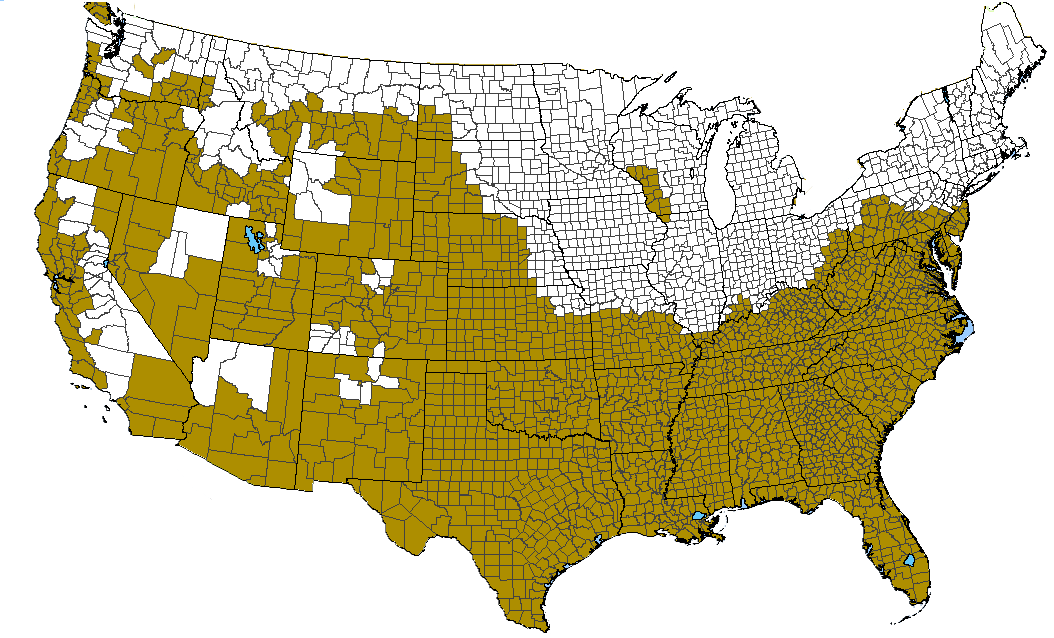
US County-level assessment of all glaciated areas ©BONAP
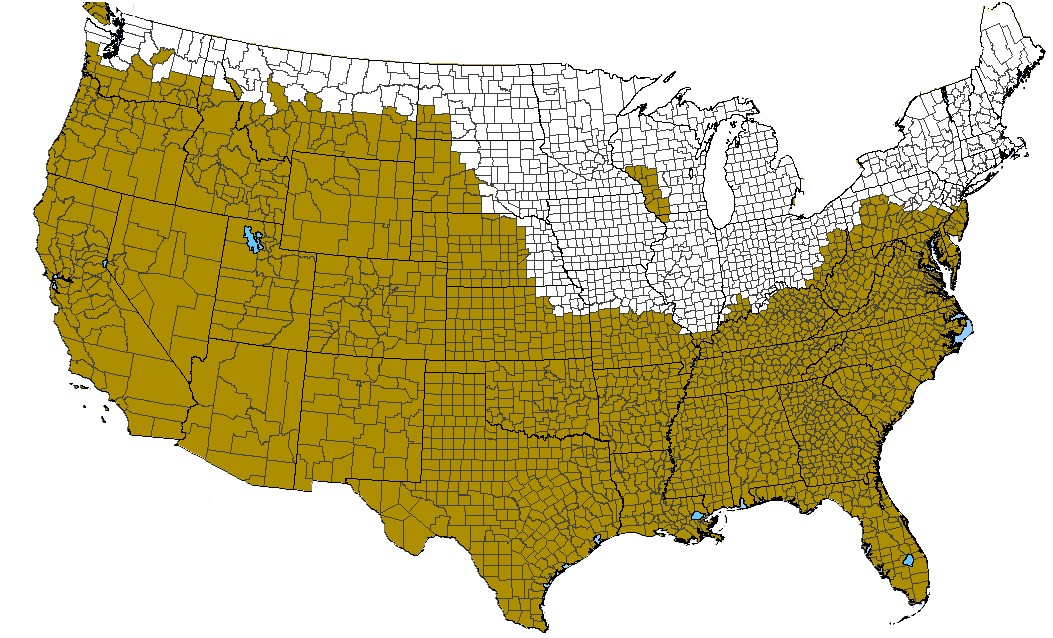
US County-level assessment of the maximum extent of glaciated areas ©BONAP
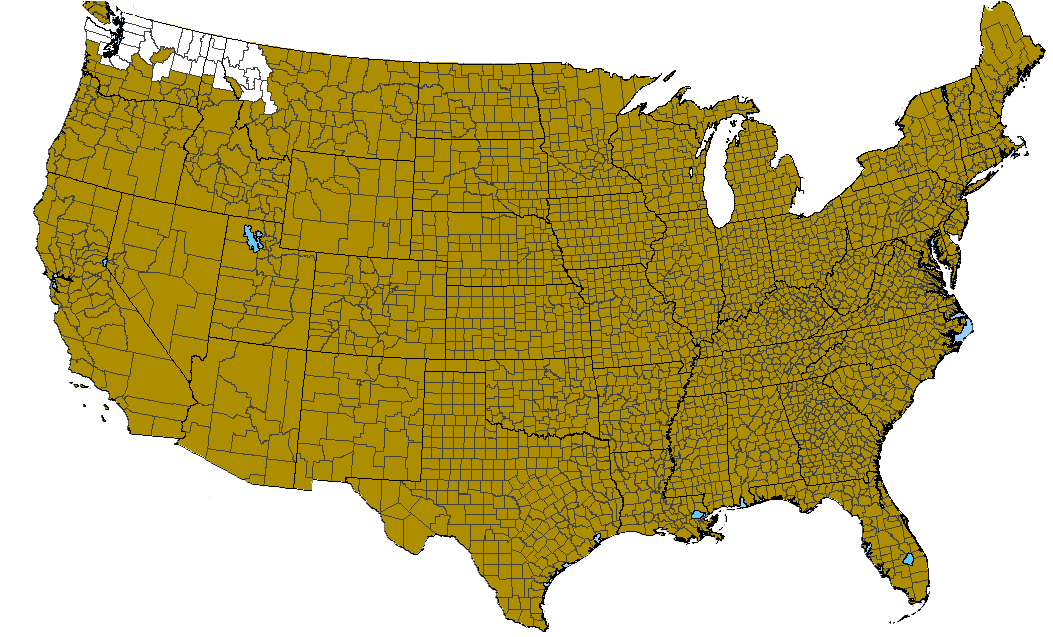
US county-level assessment of the Cordileran Ice Sheet ©BONAP
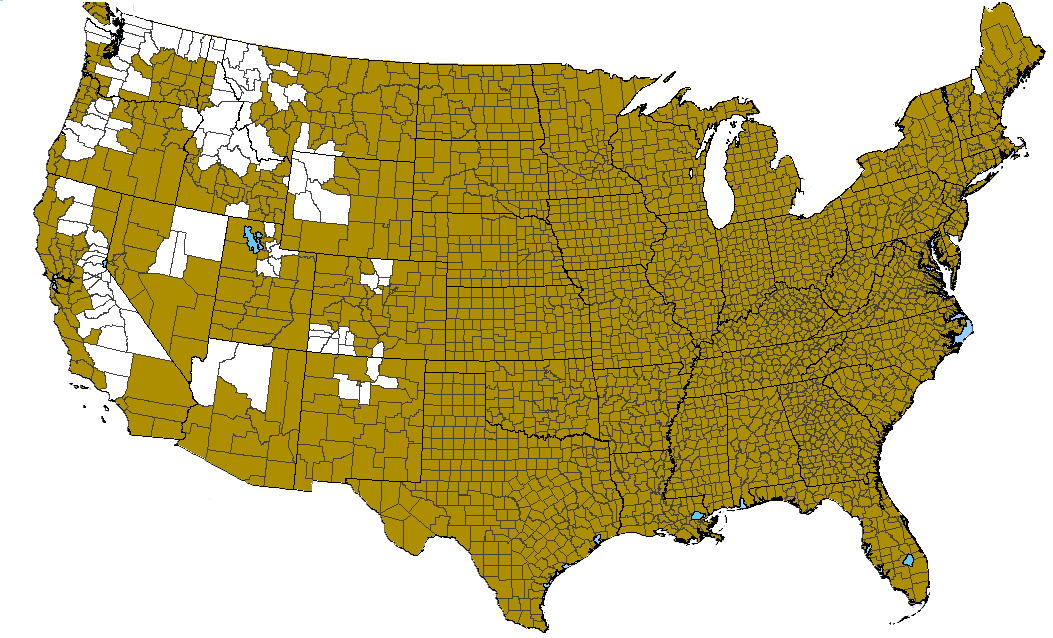
US county-level assessment of mountain glaciers ©BONAP
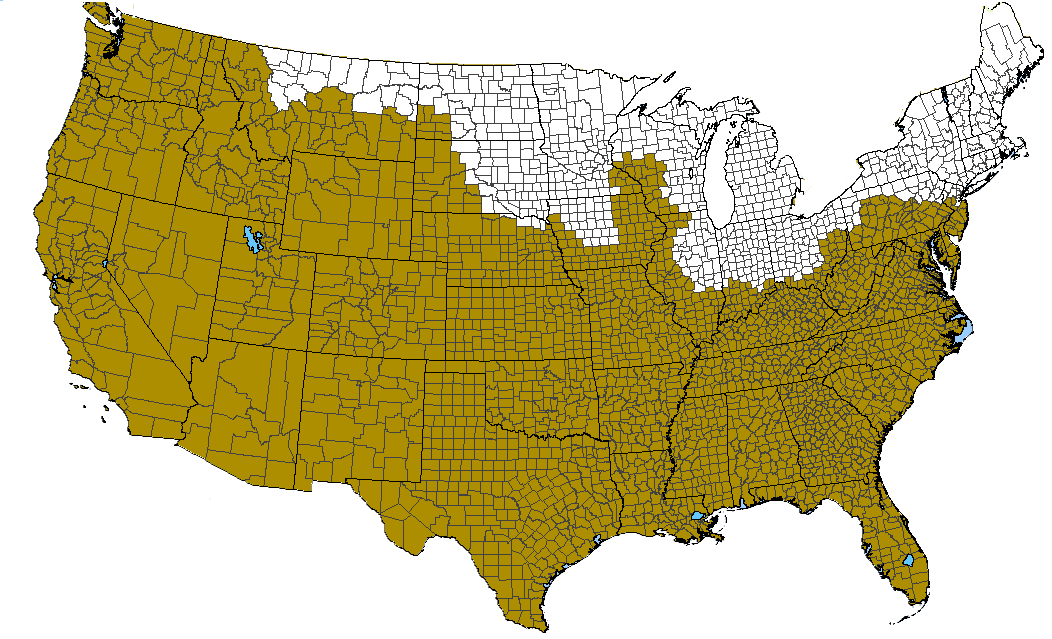
US county-level assessment of the Wisconsin Ice Sheet ©BONAP
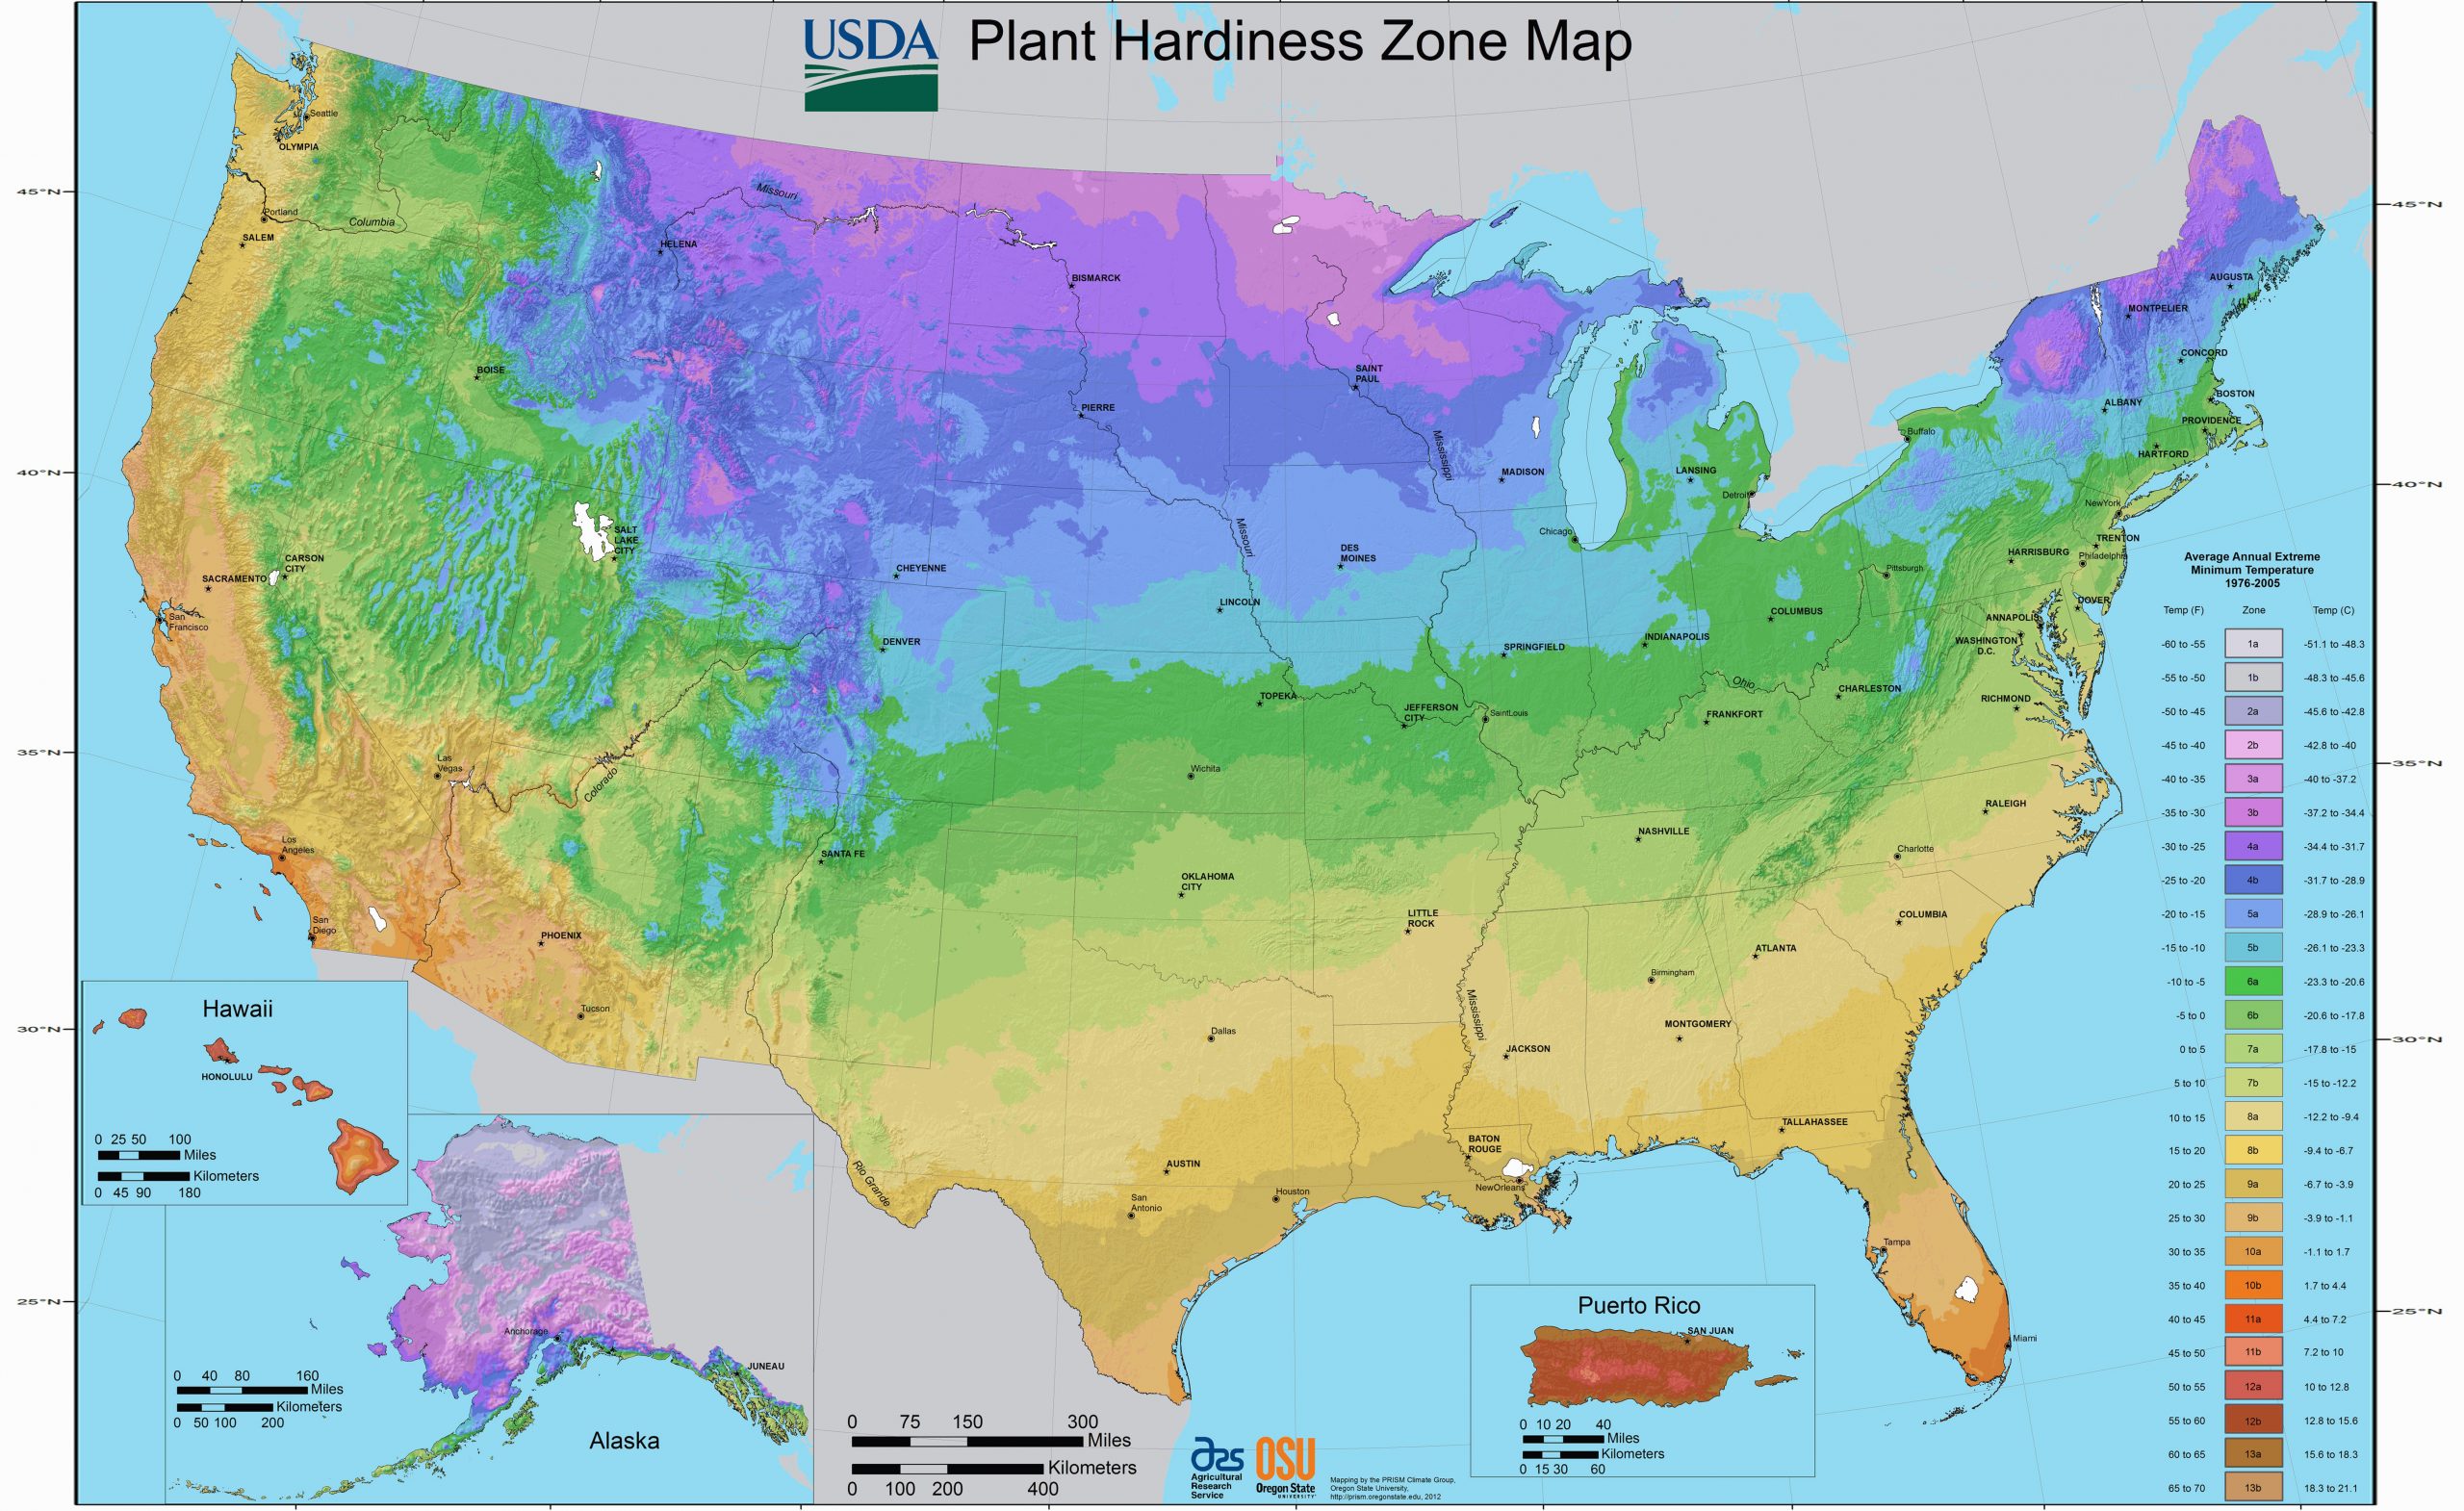
USDA Plant Hardiness Zones
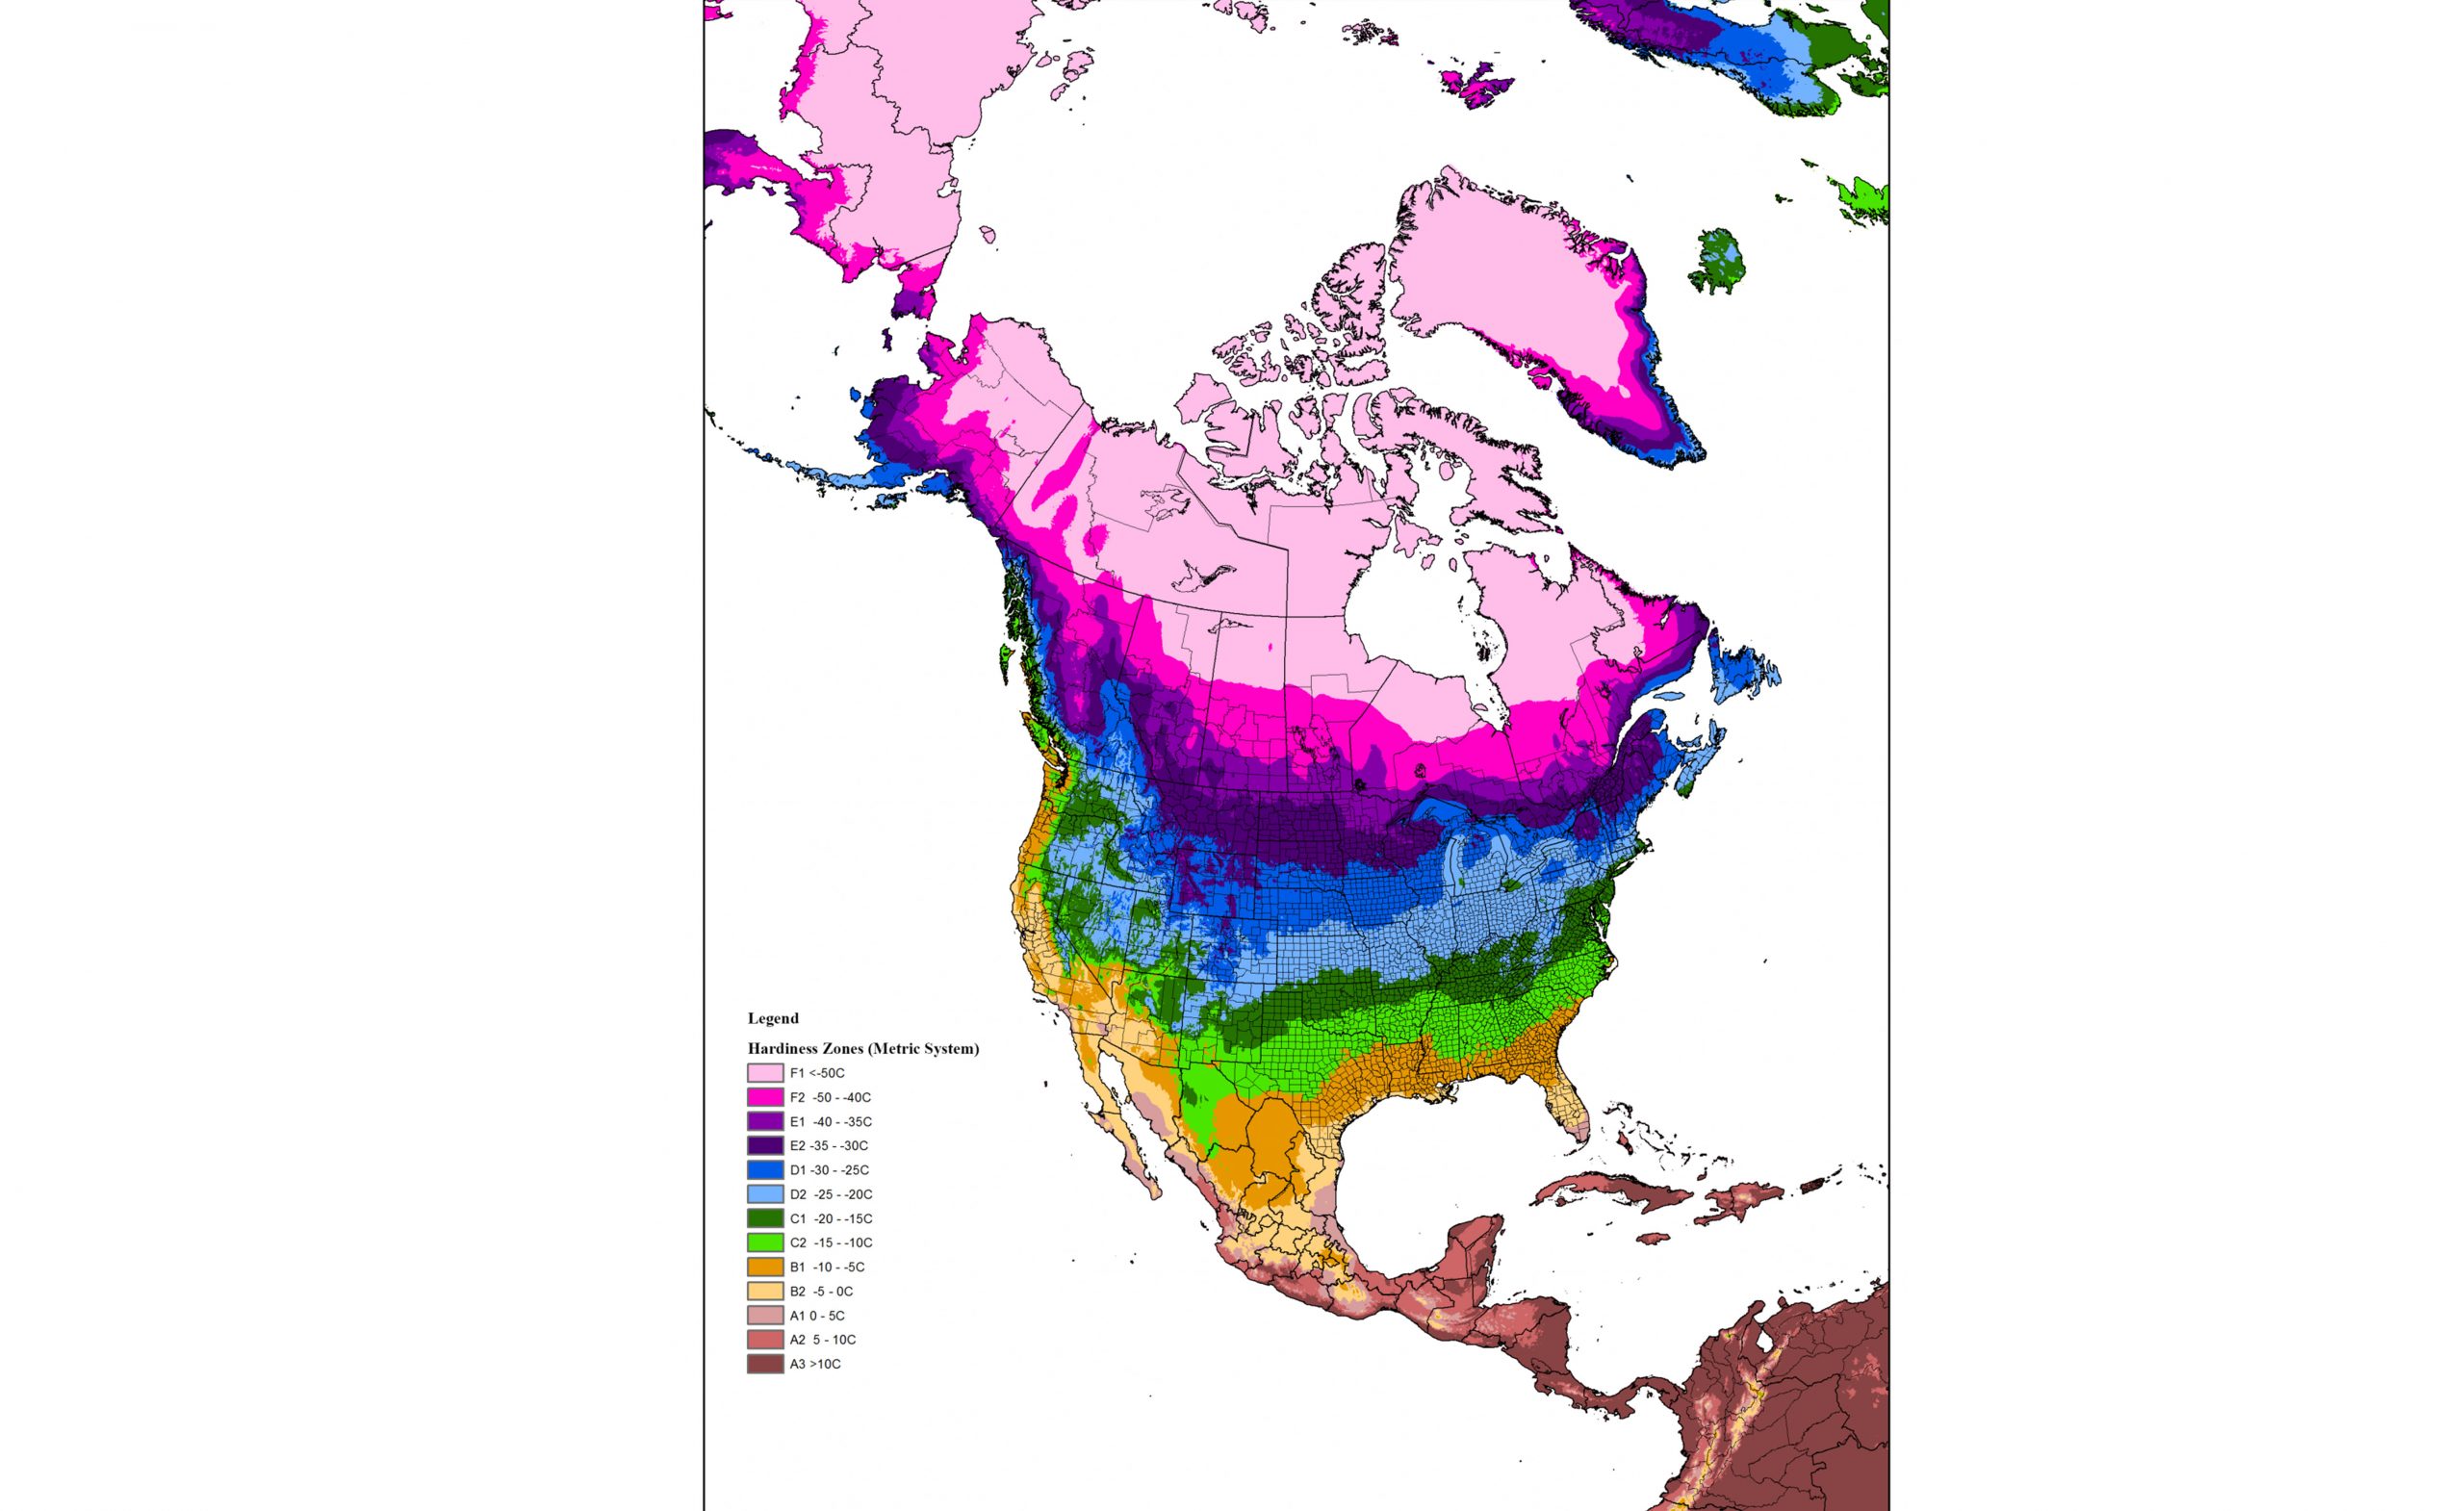
Hardiness Zones (Metric System) ©BONAP
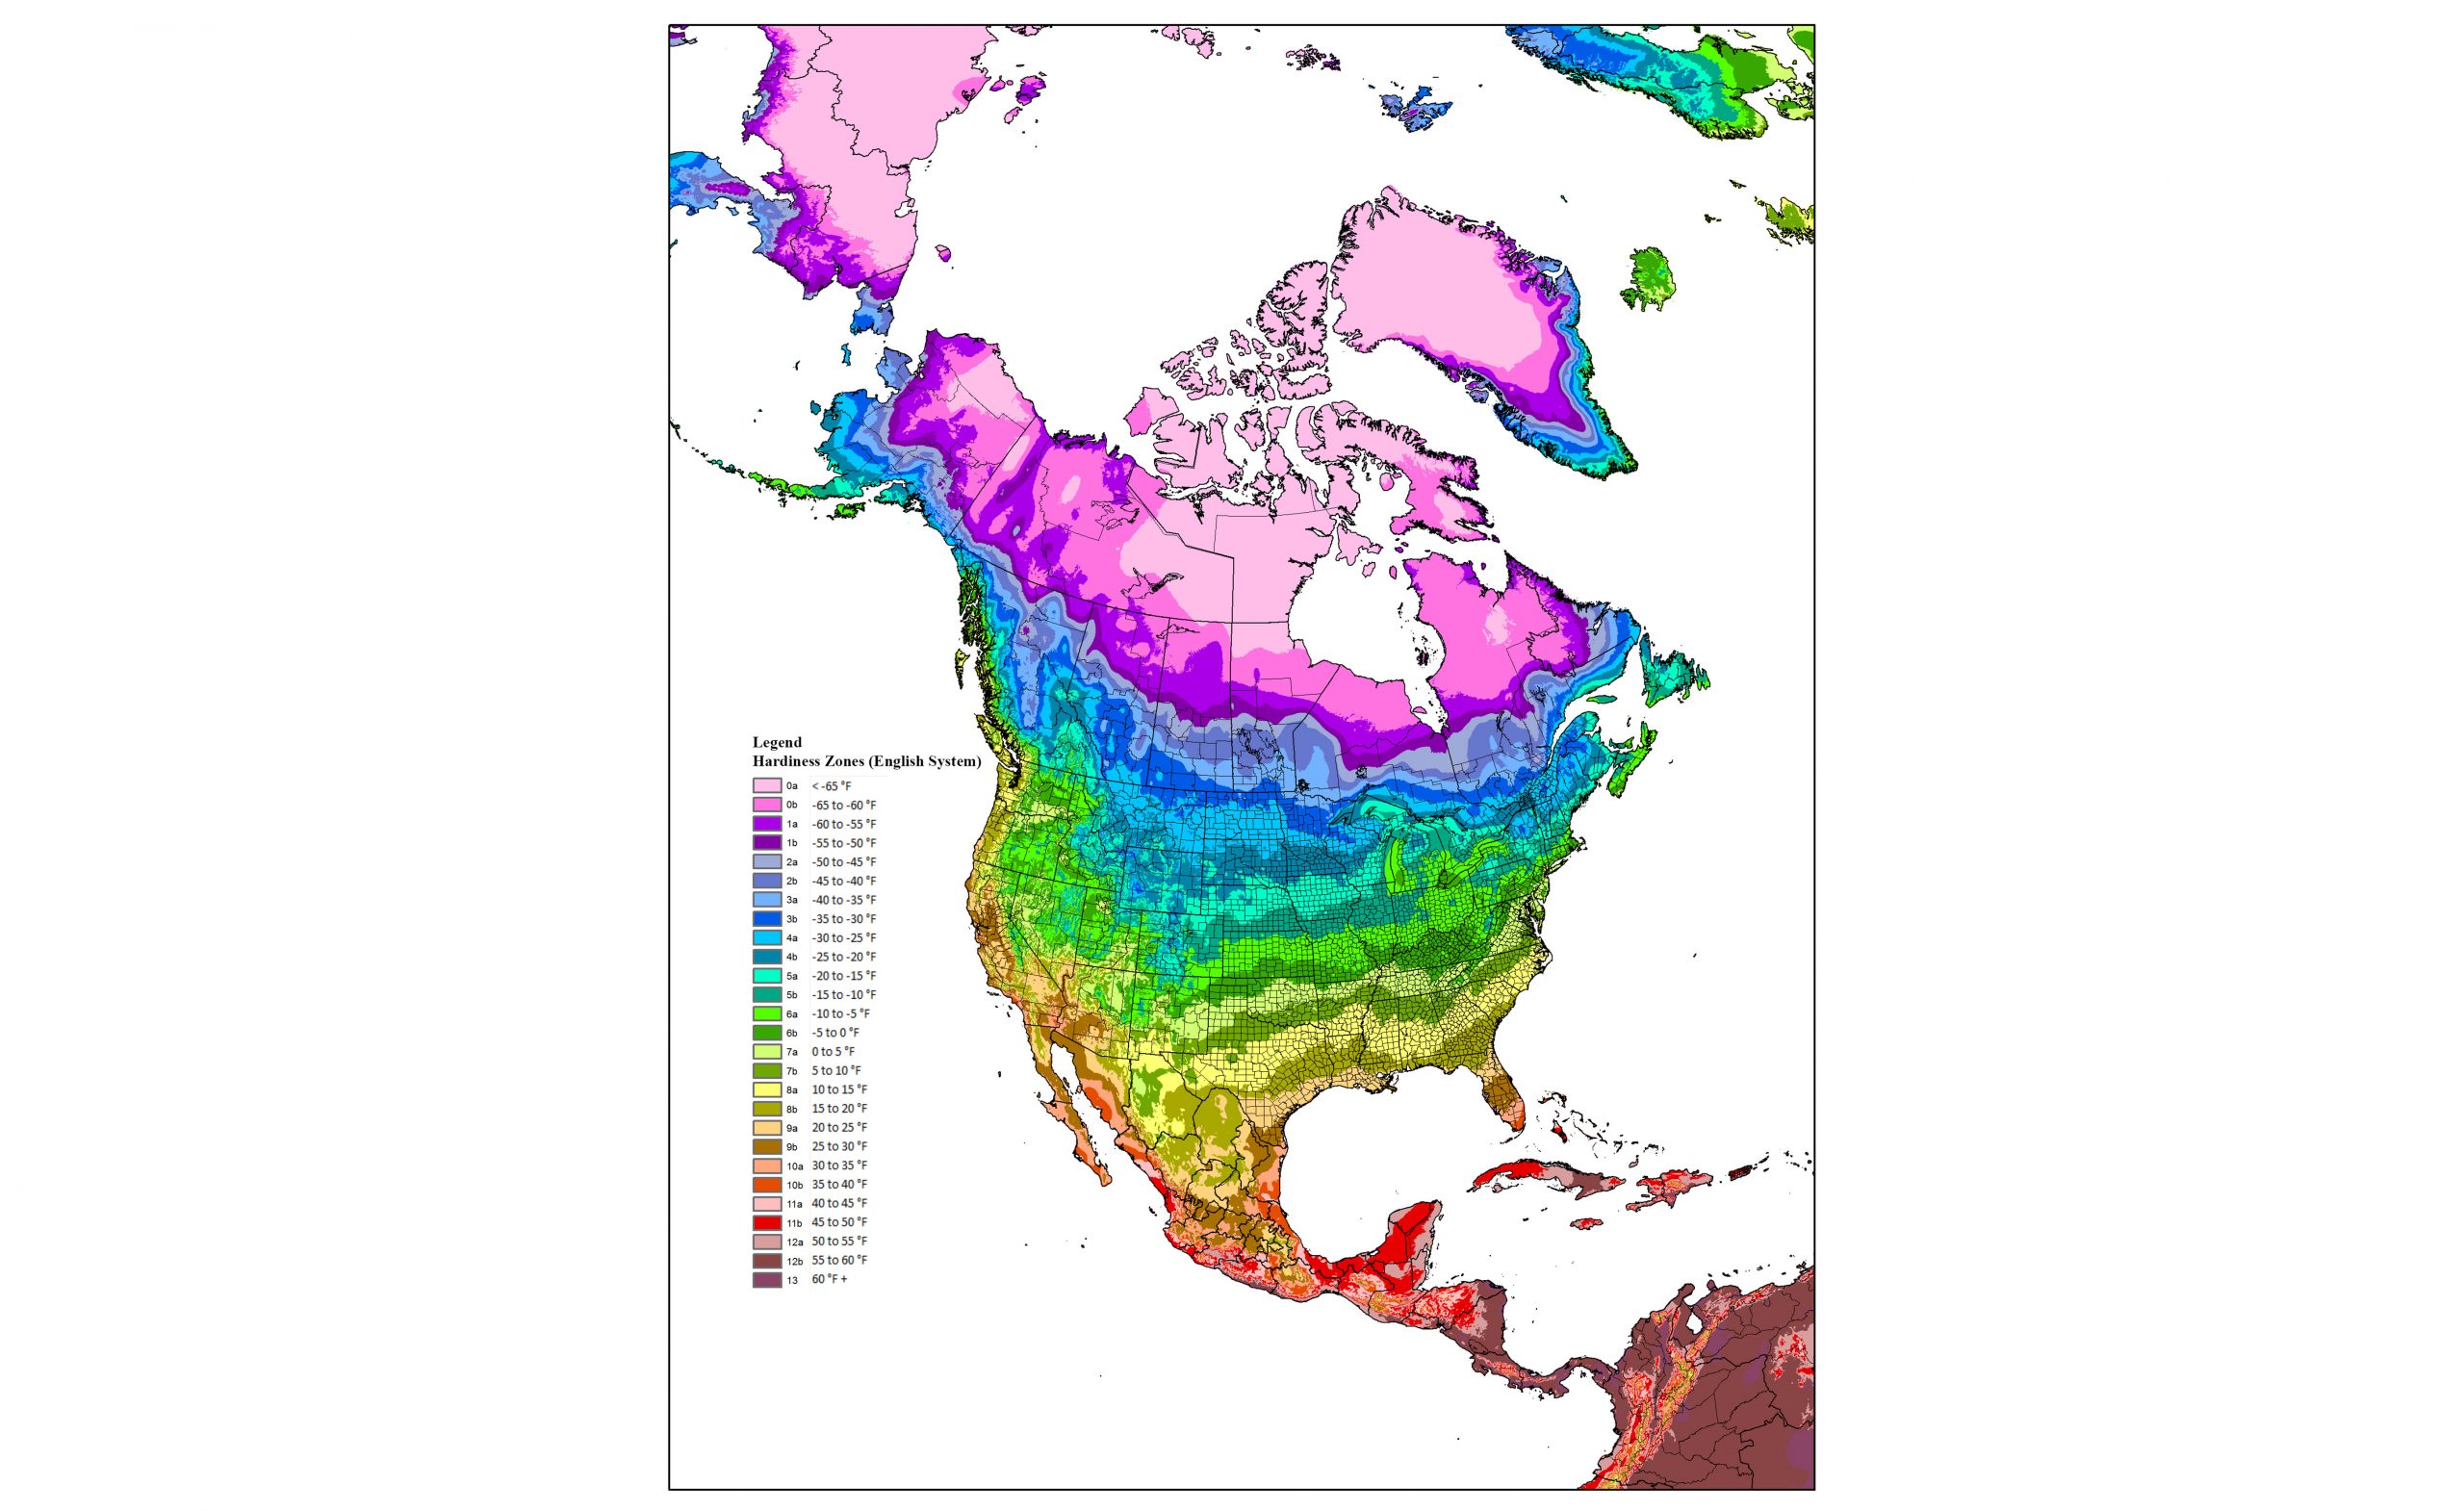
Hardiness Zones (English System) ©BONAP