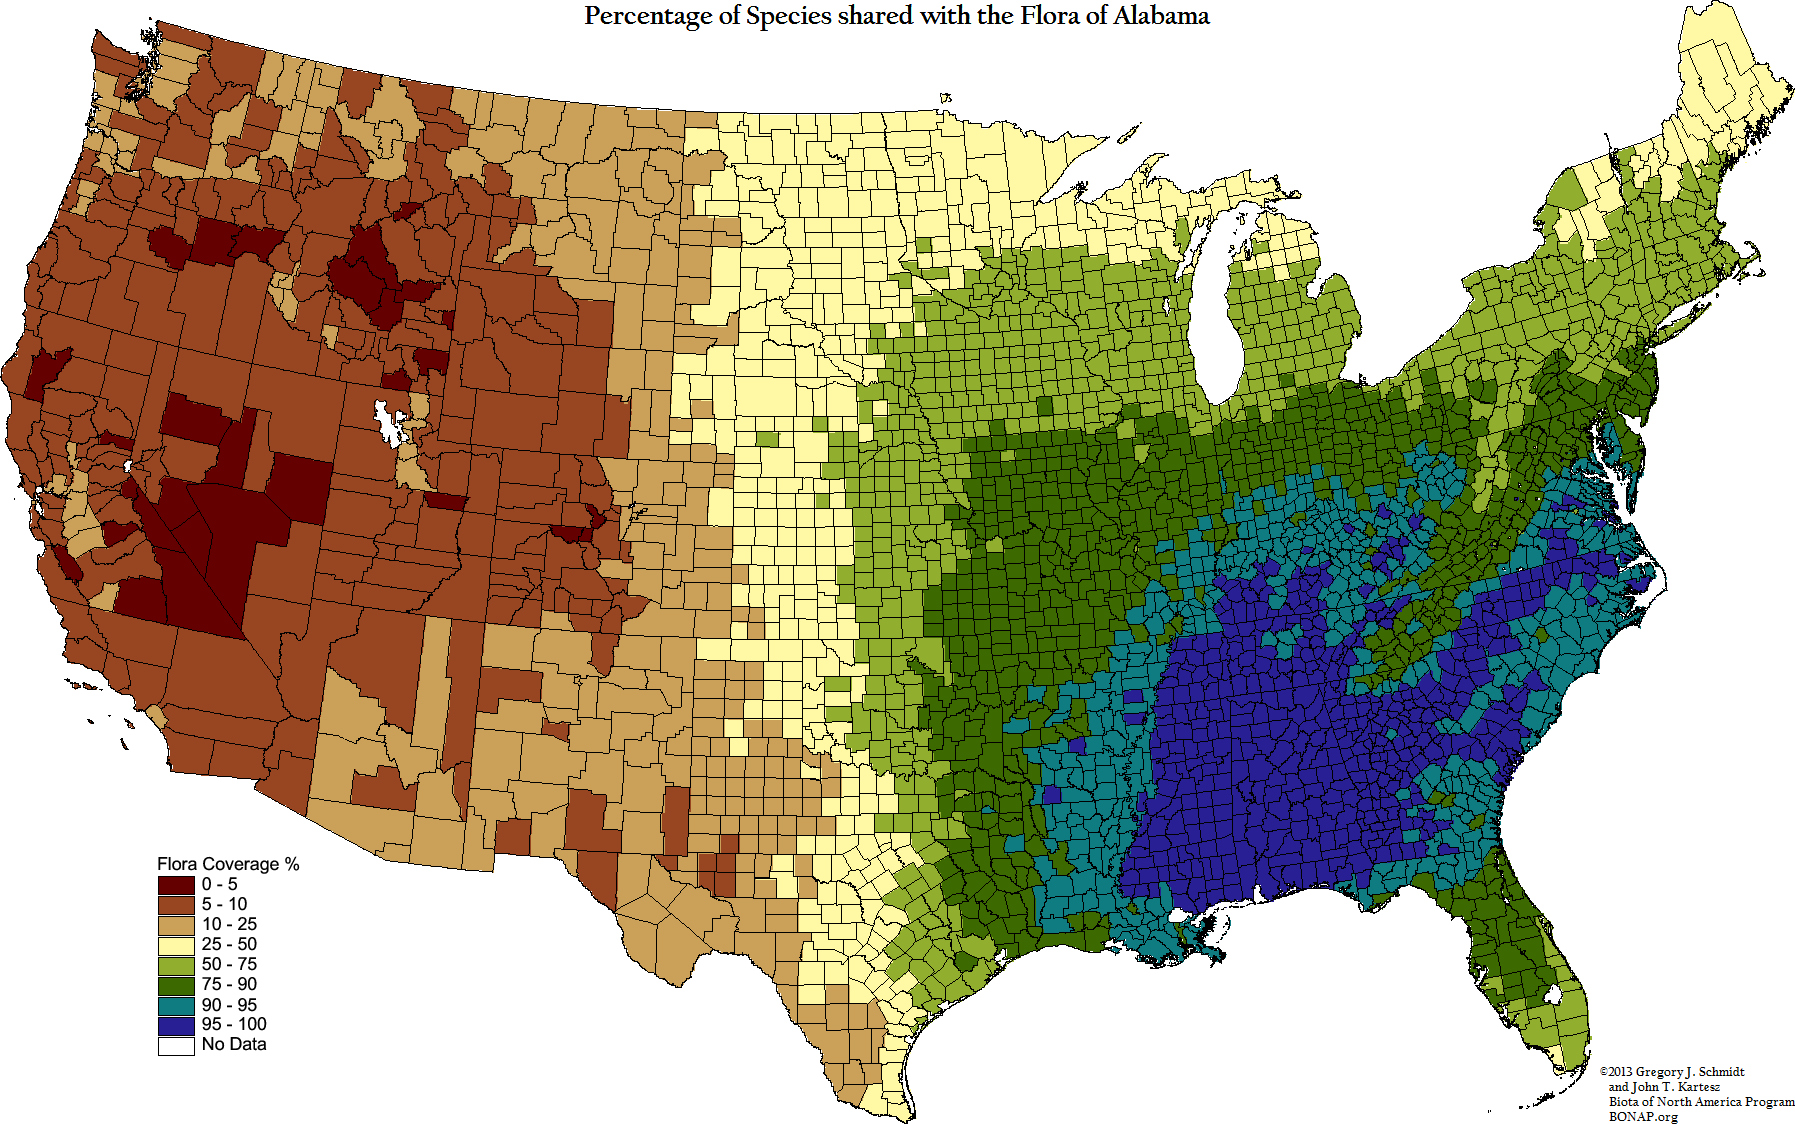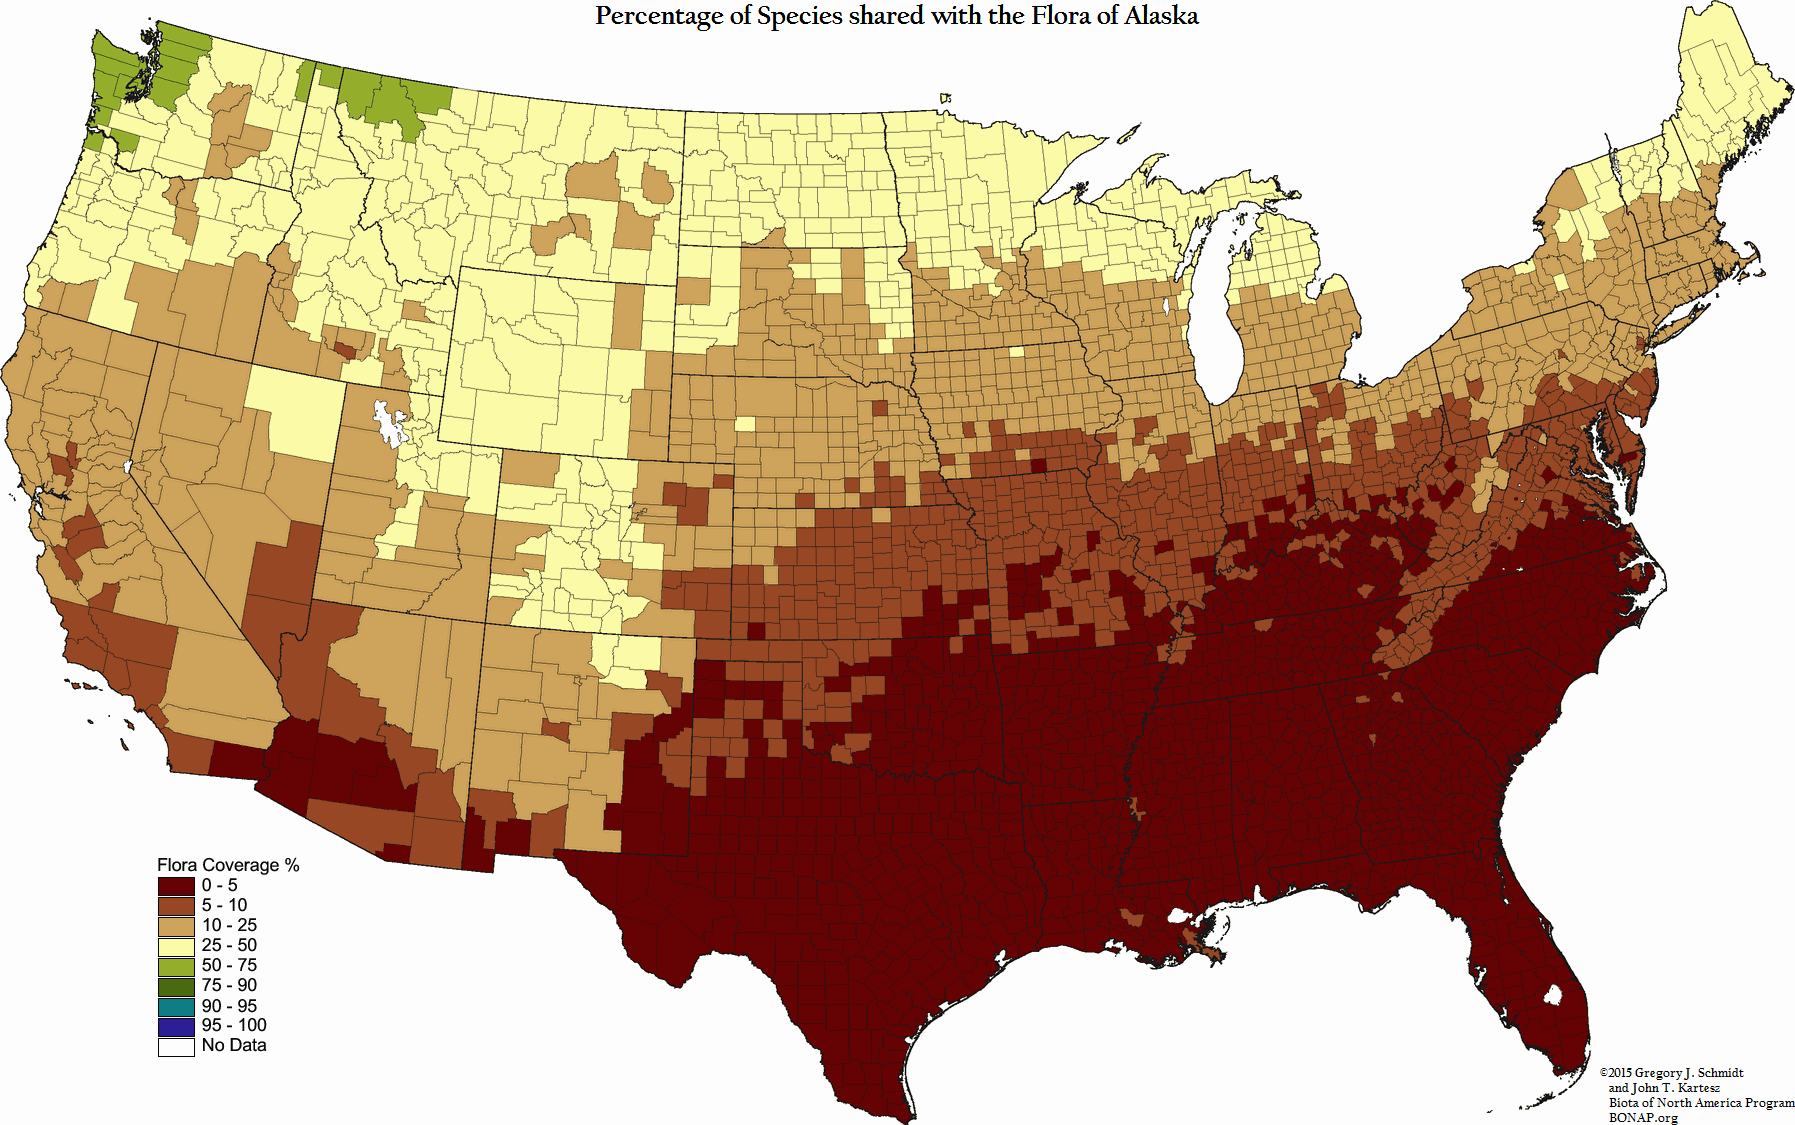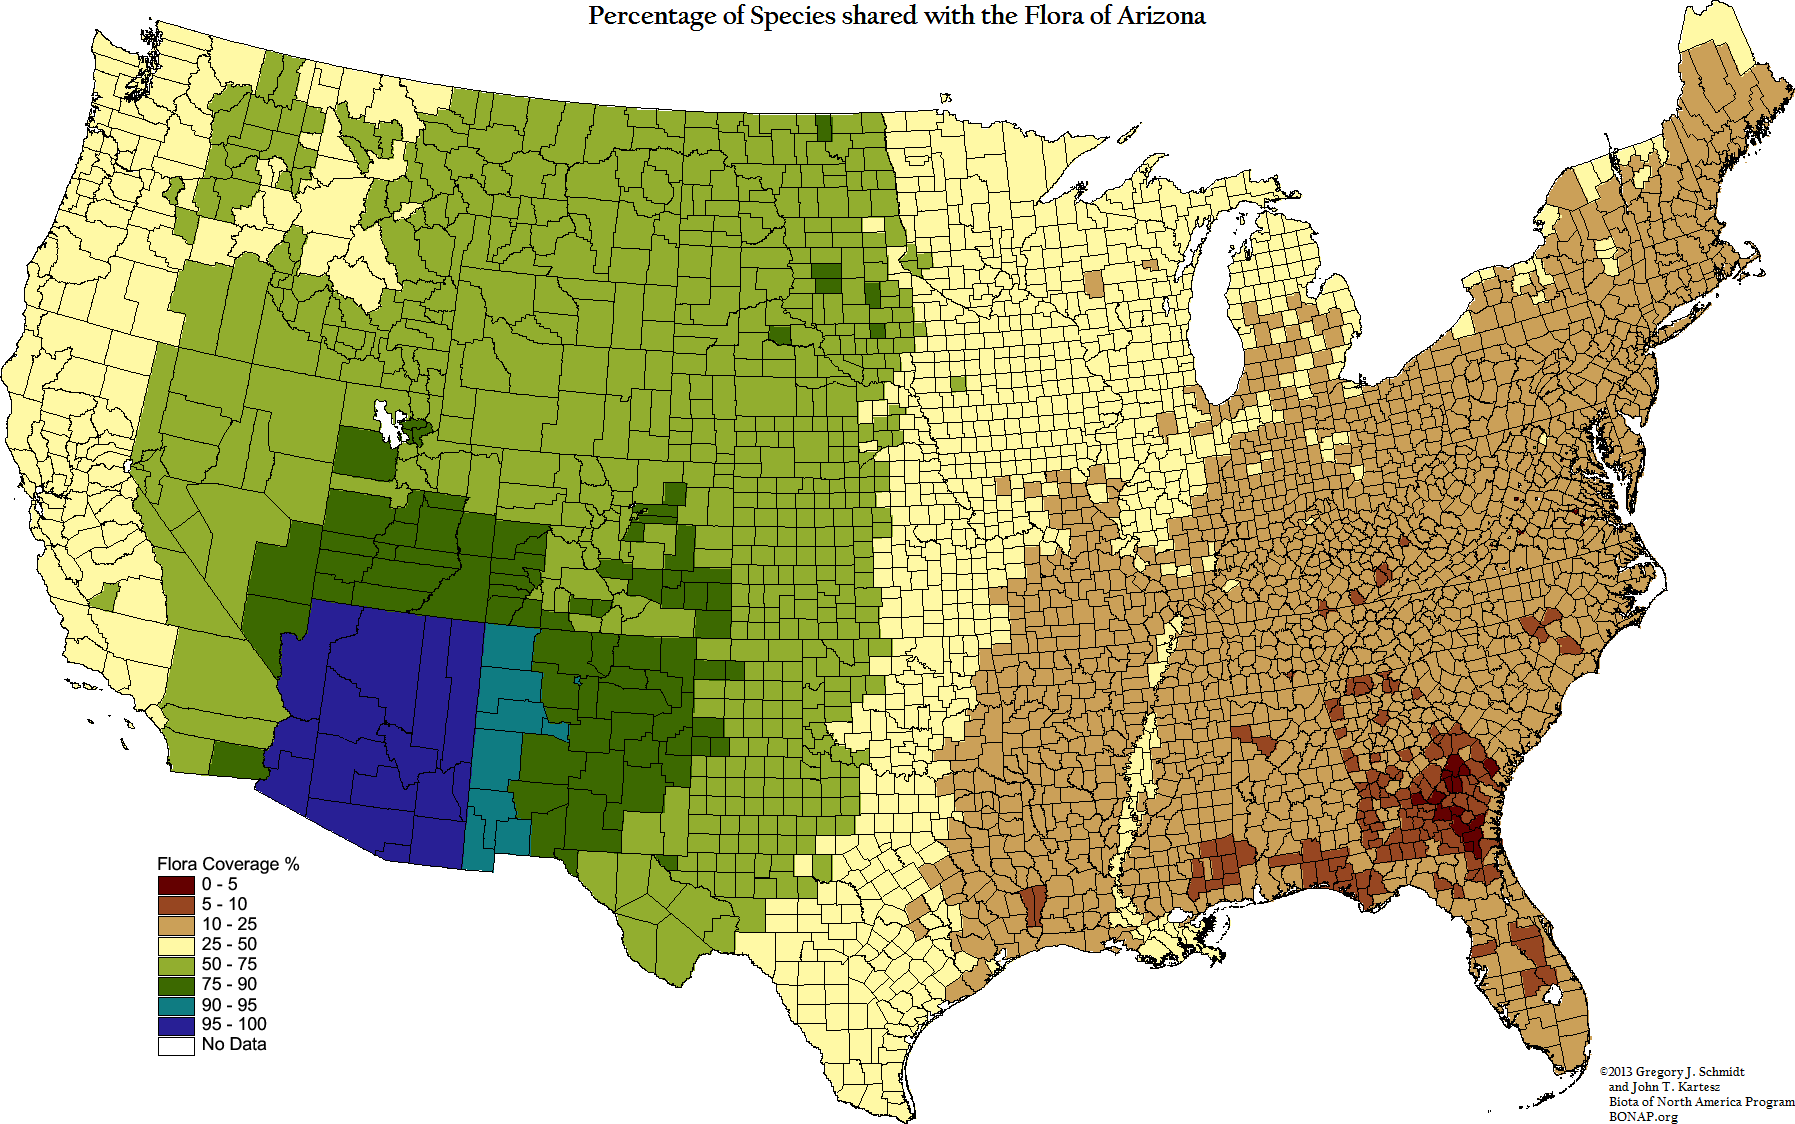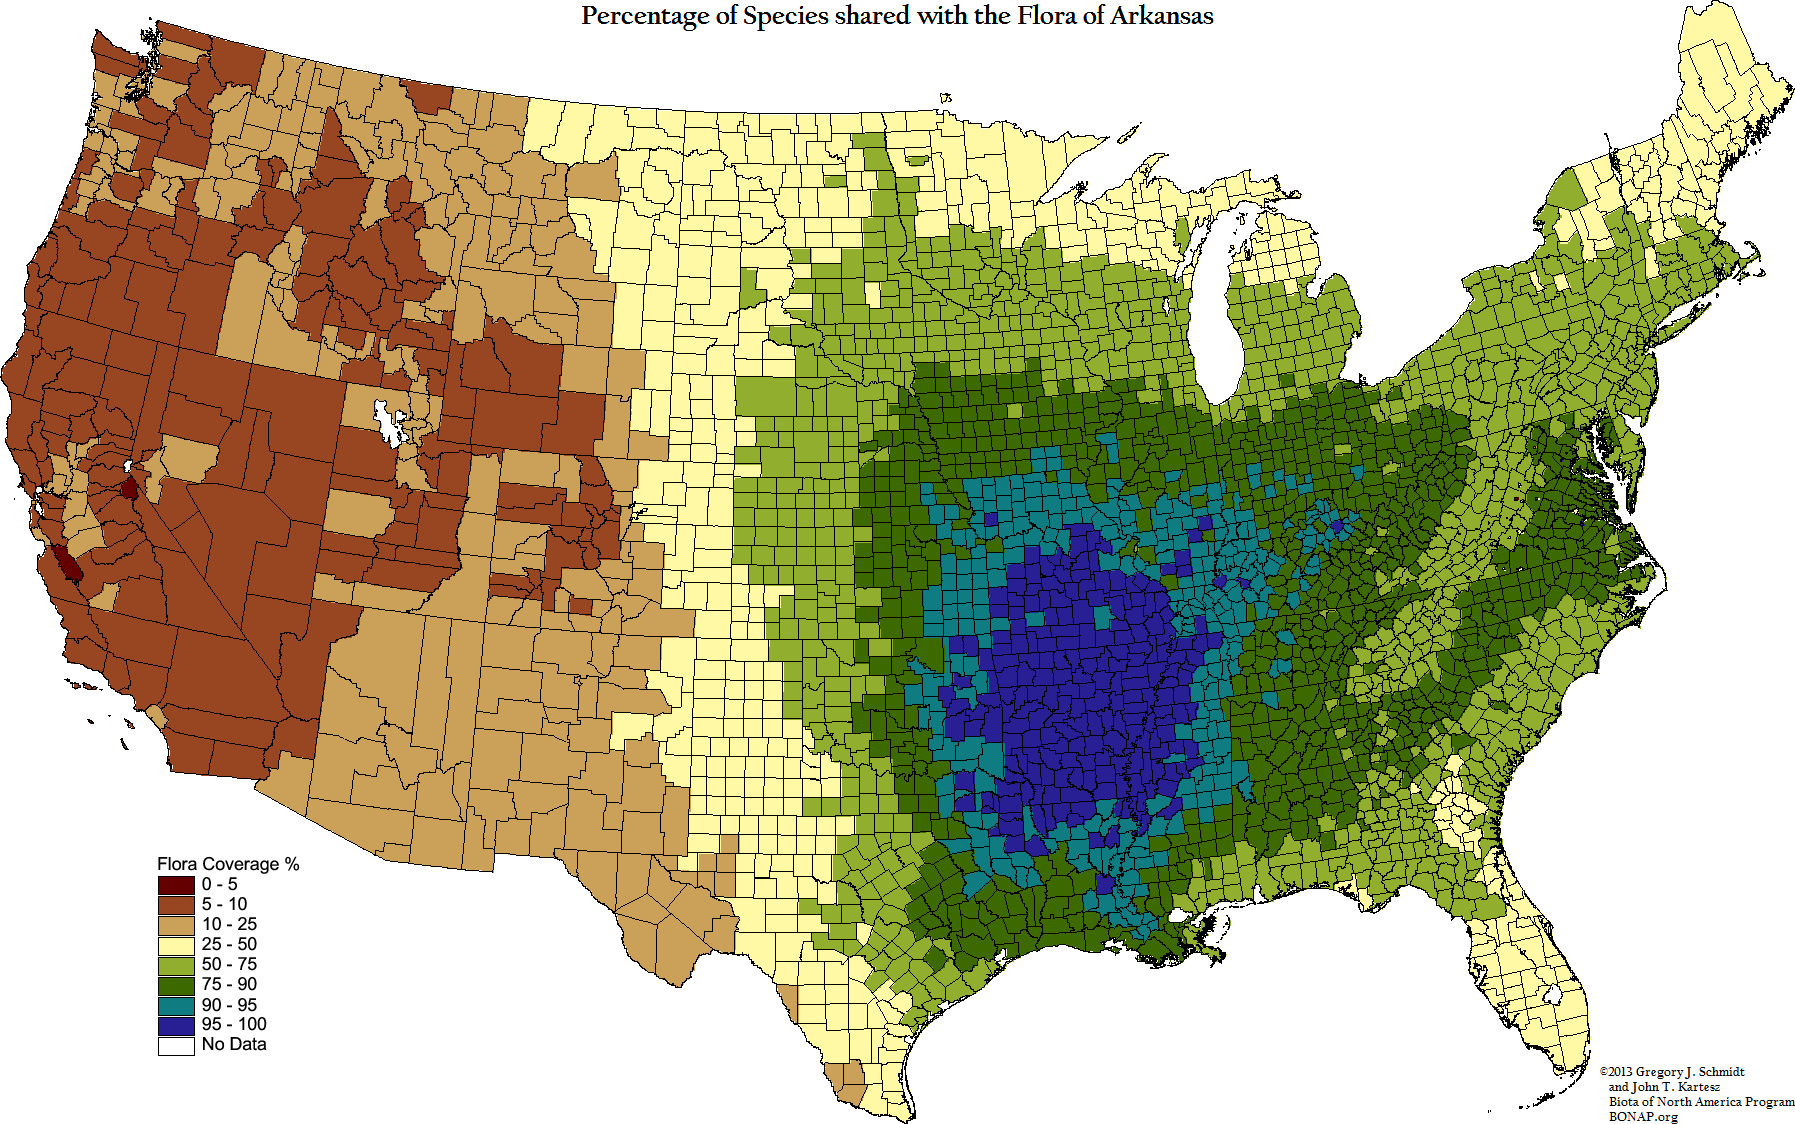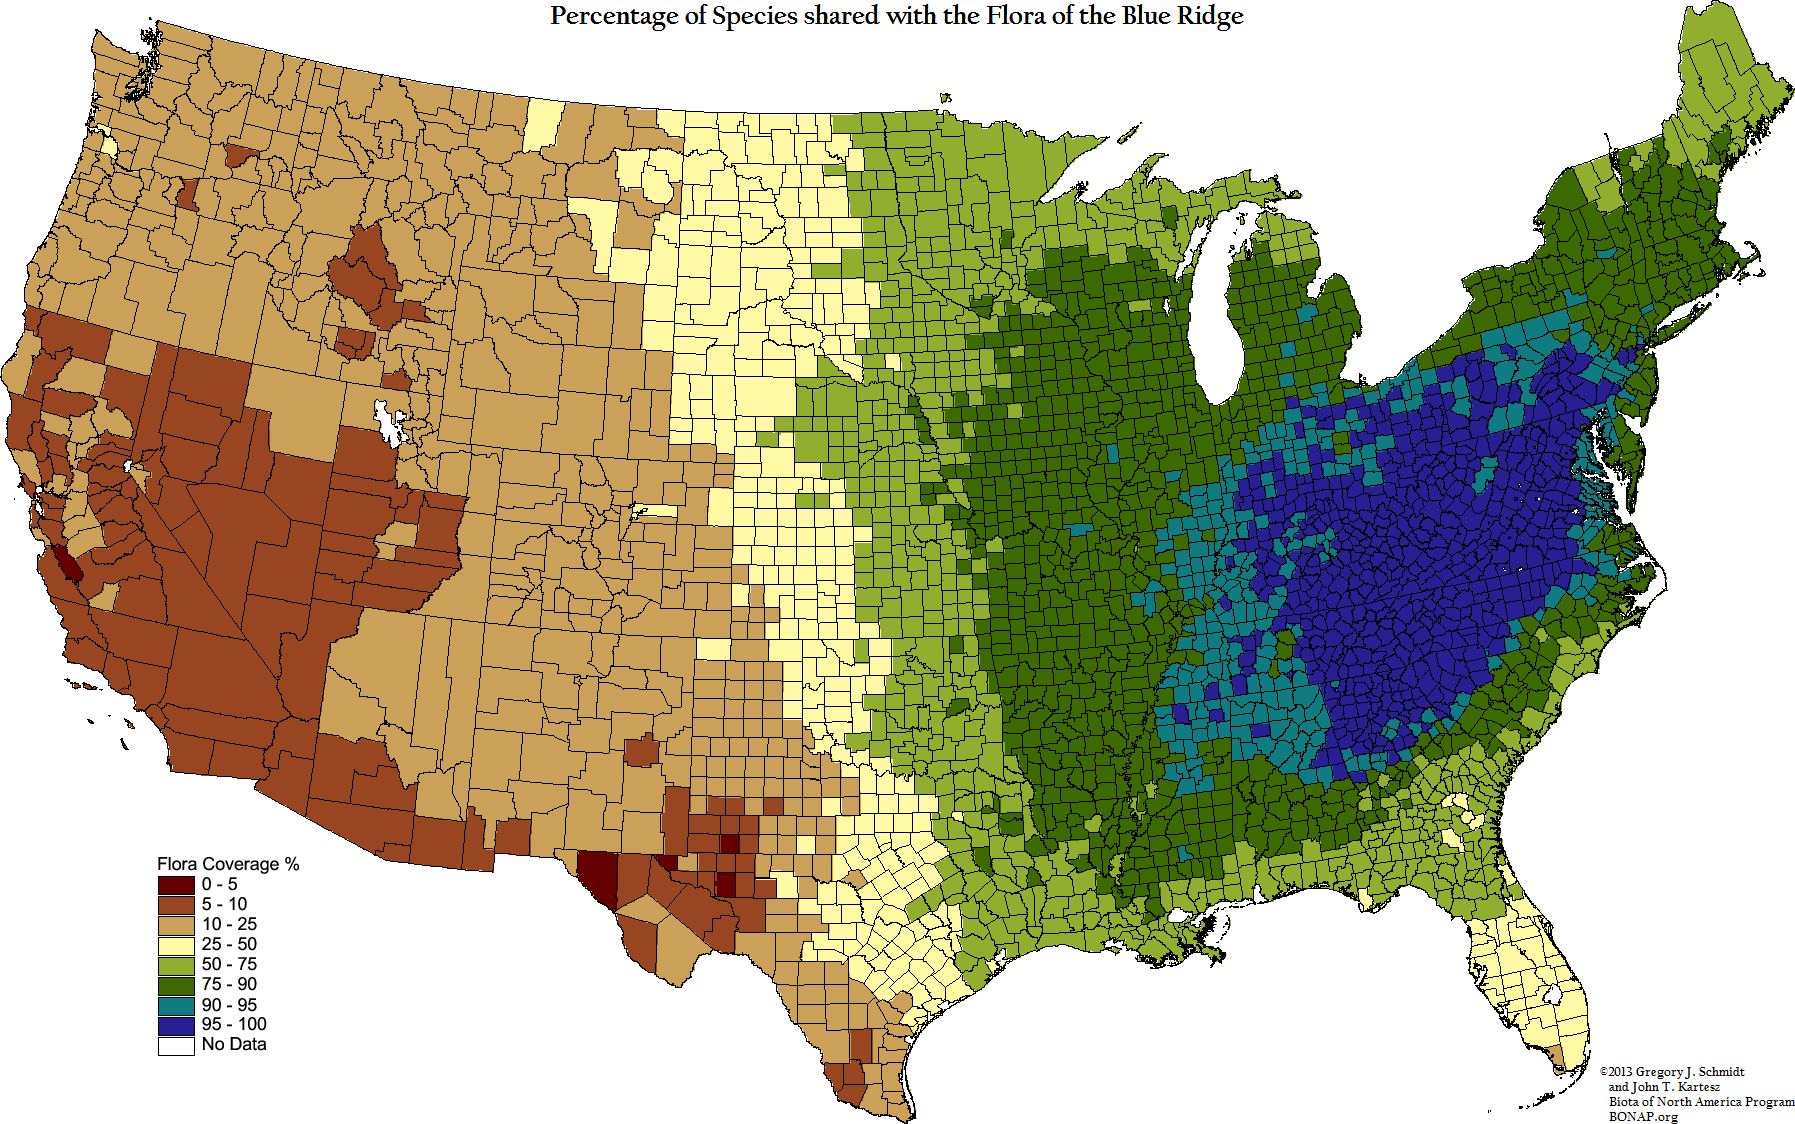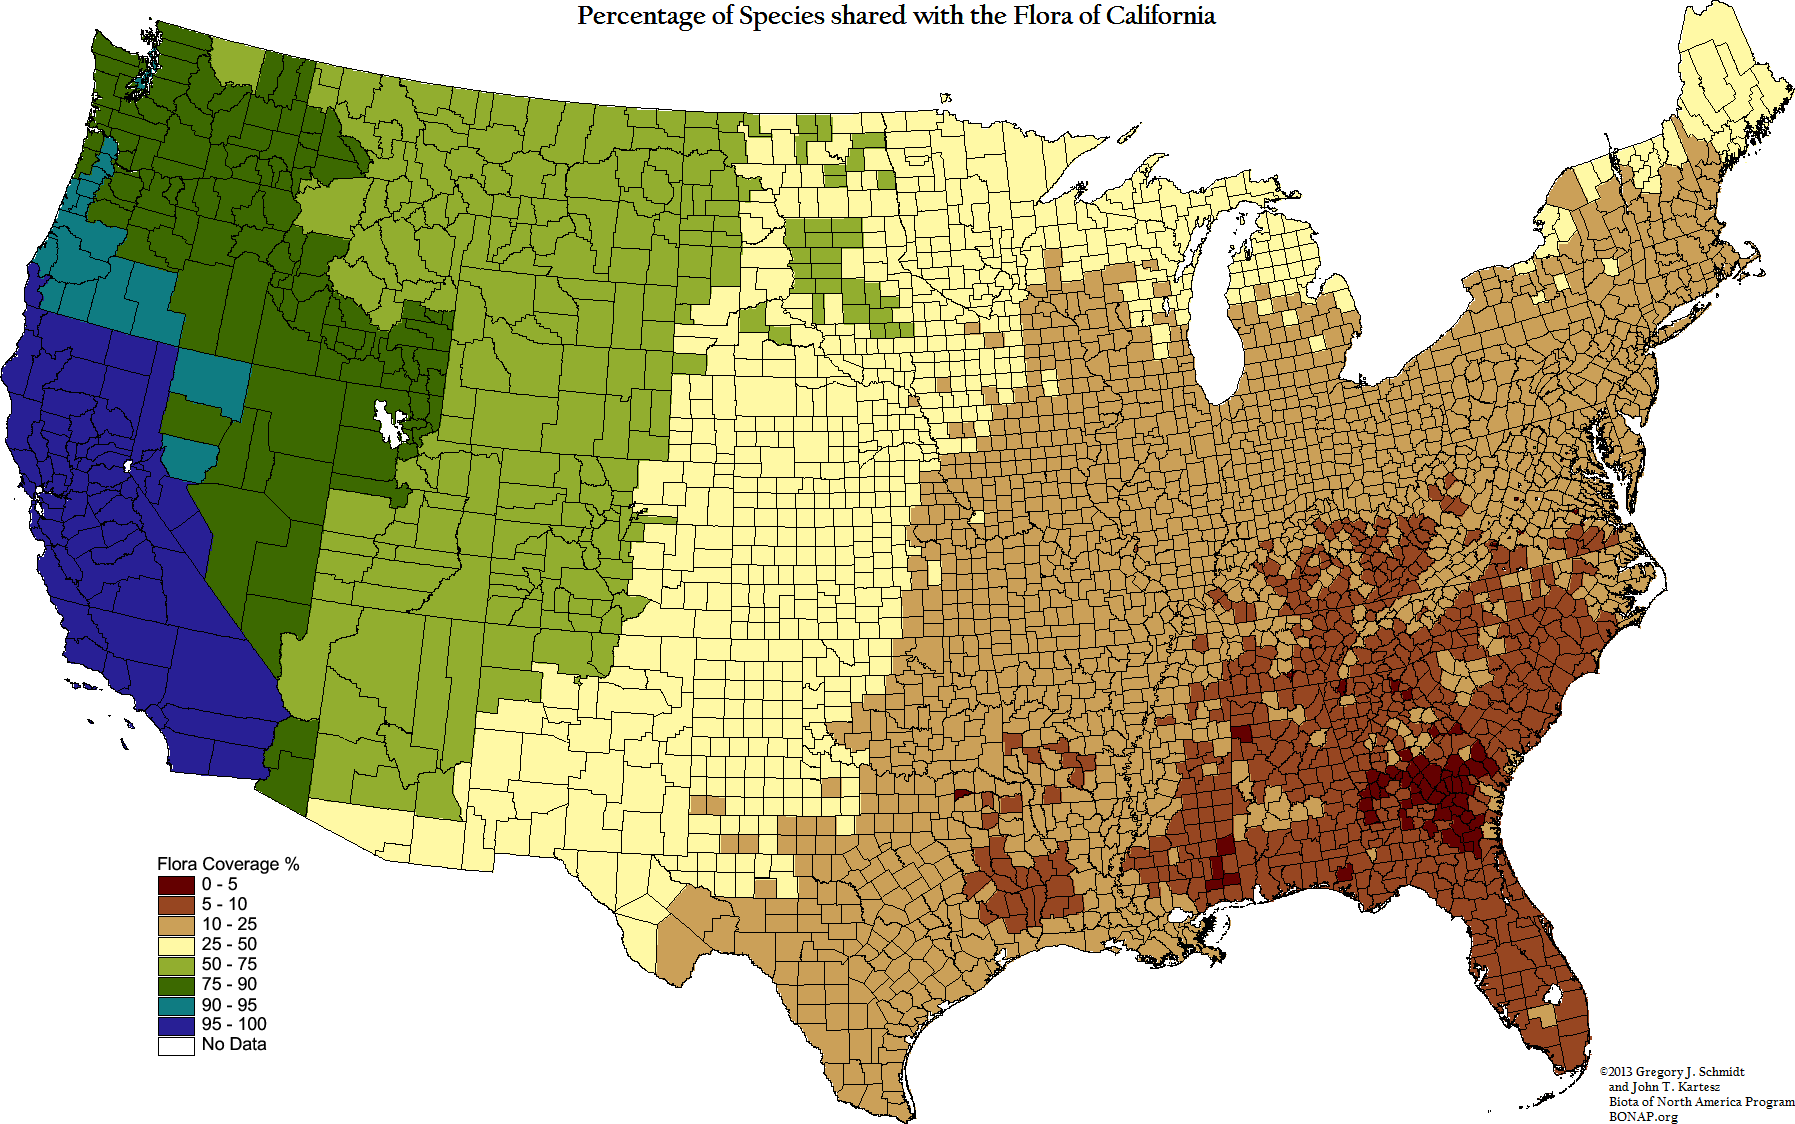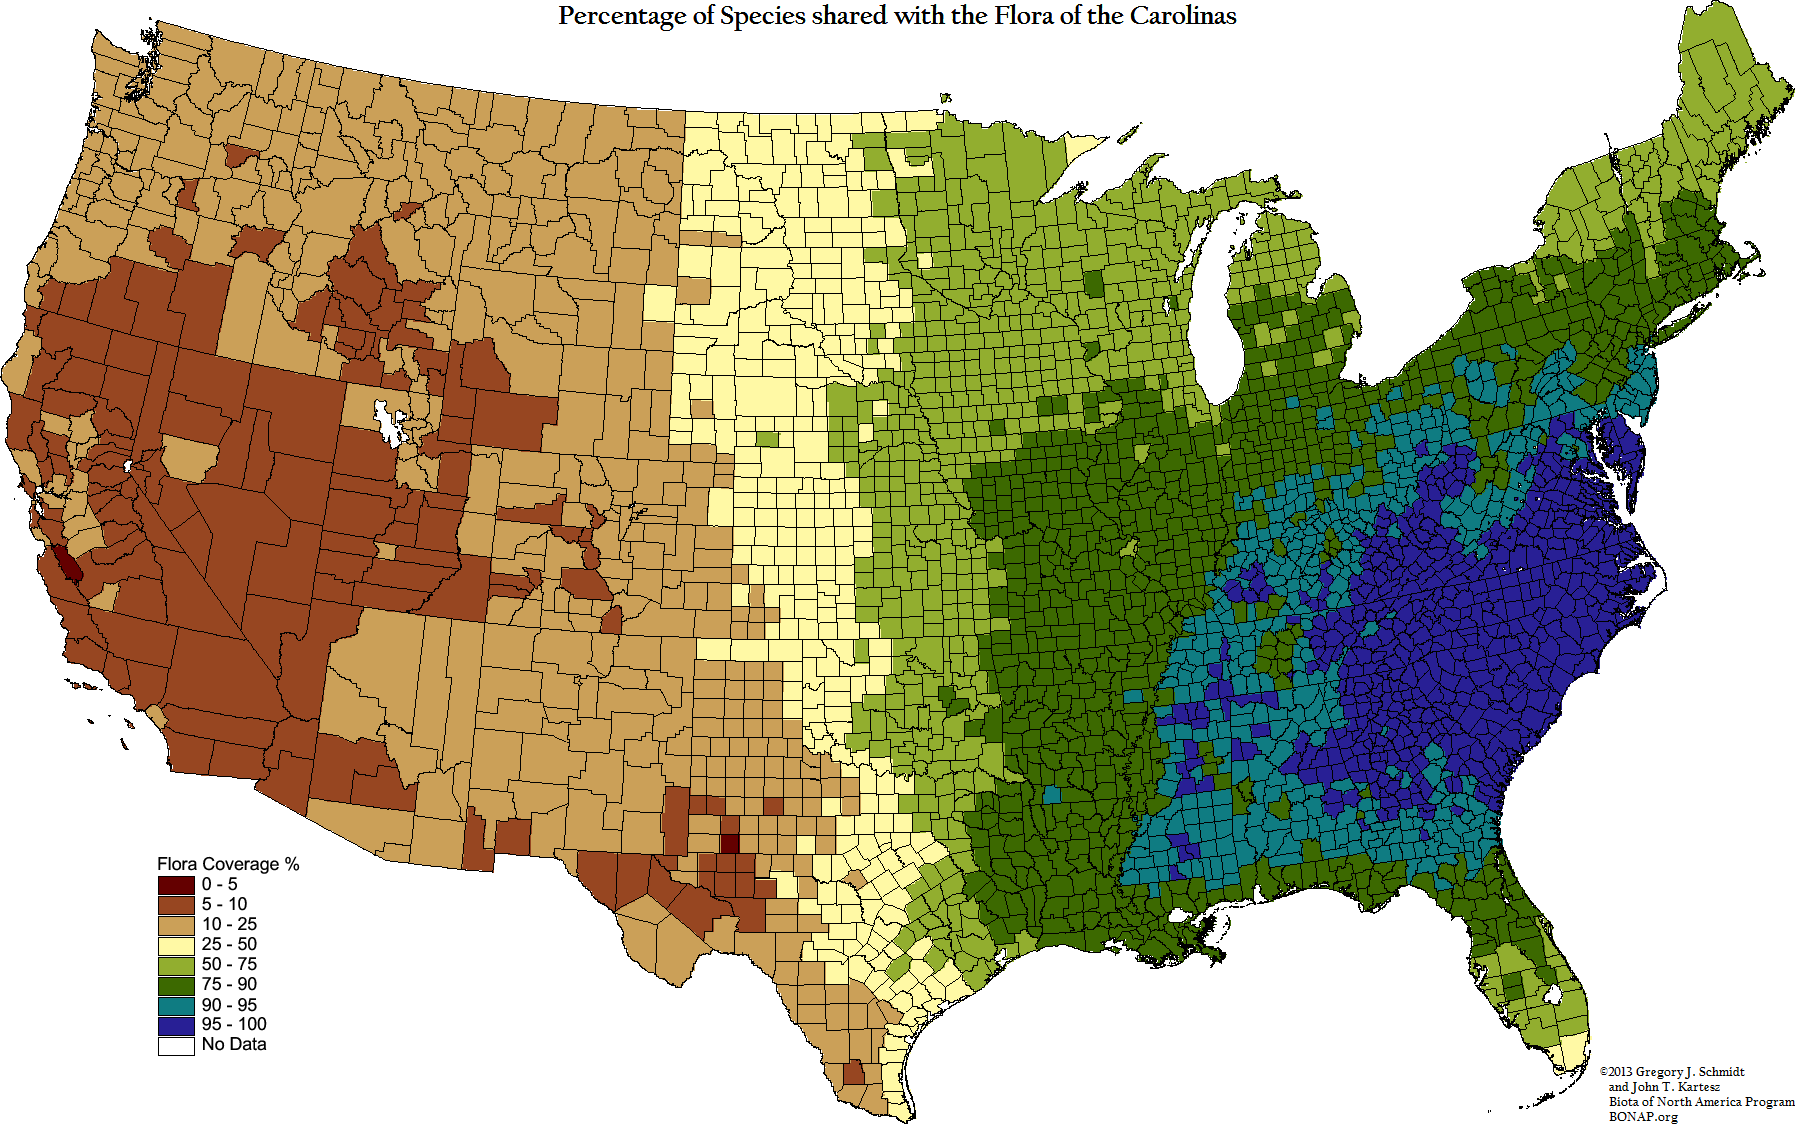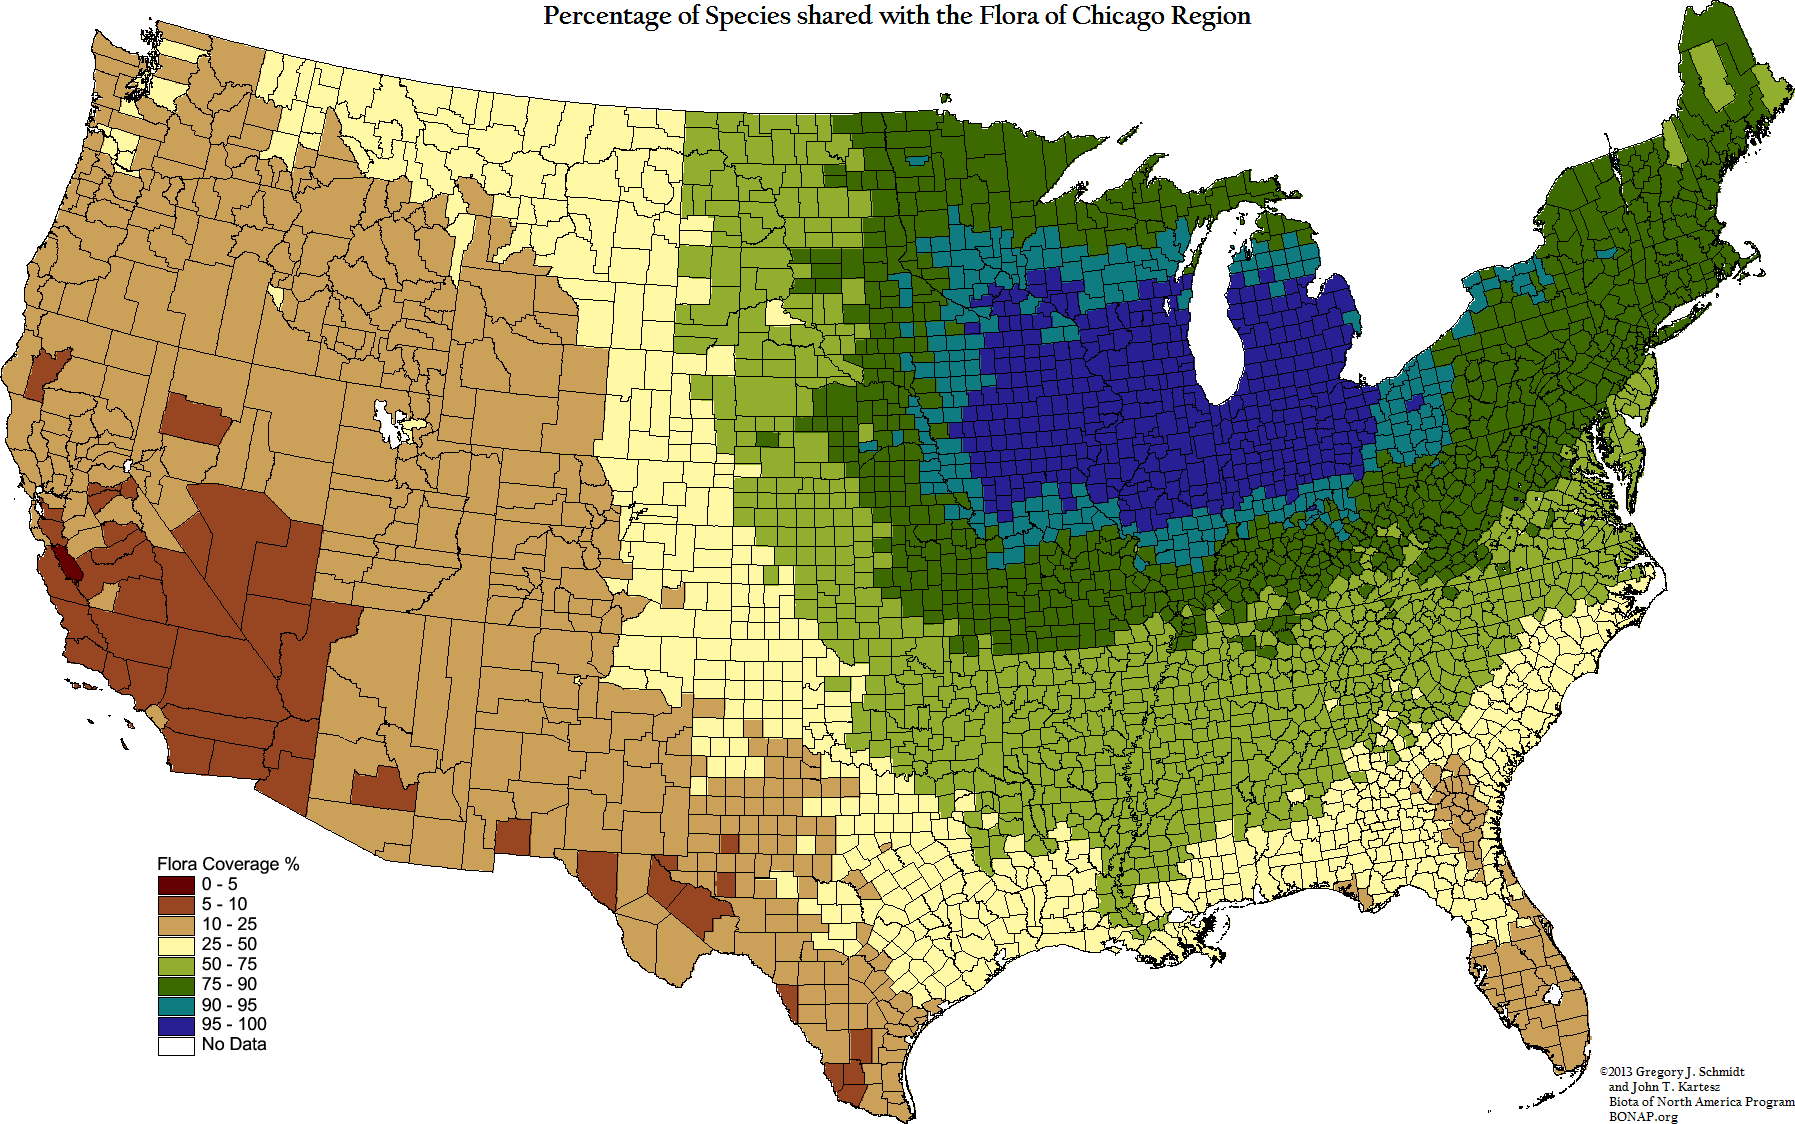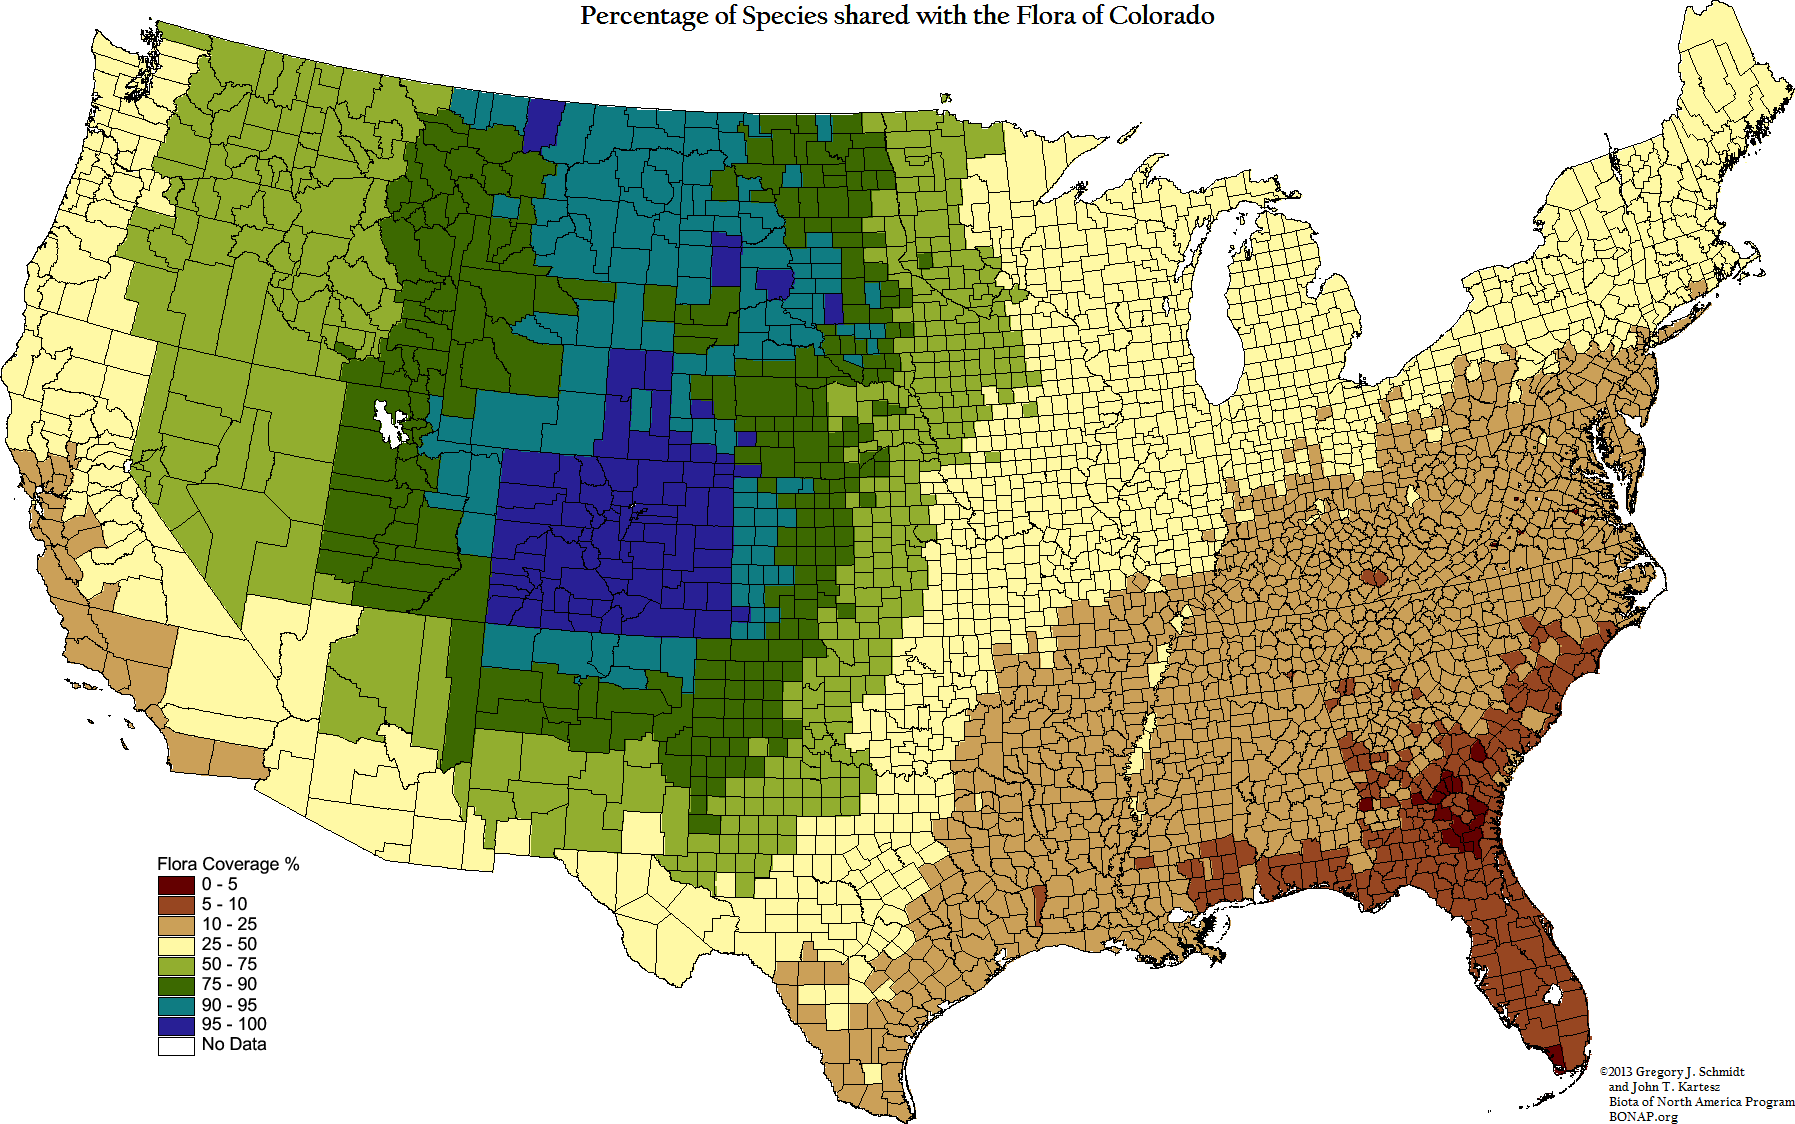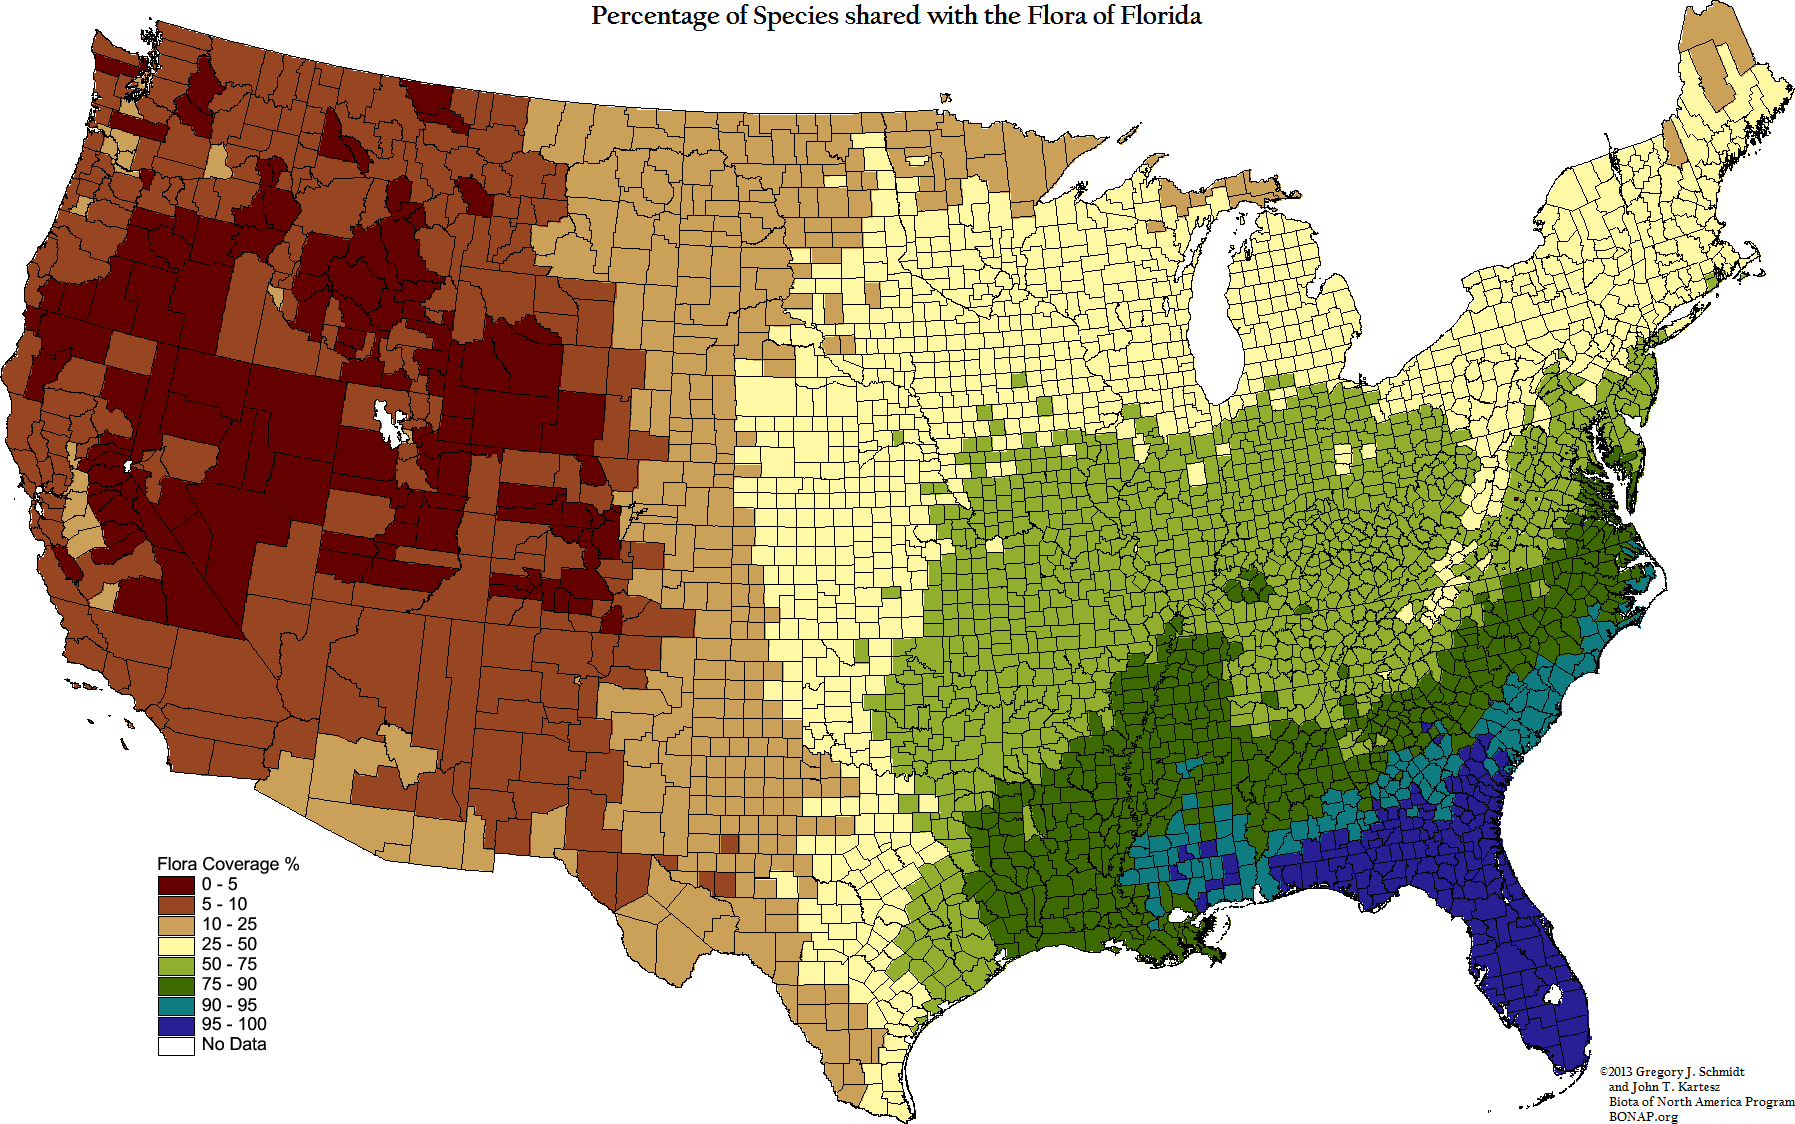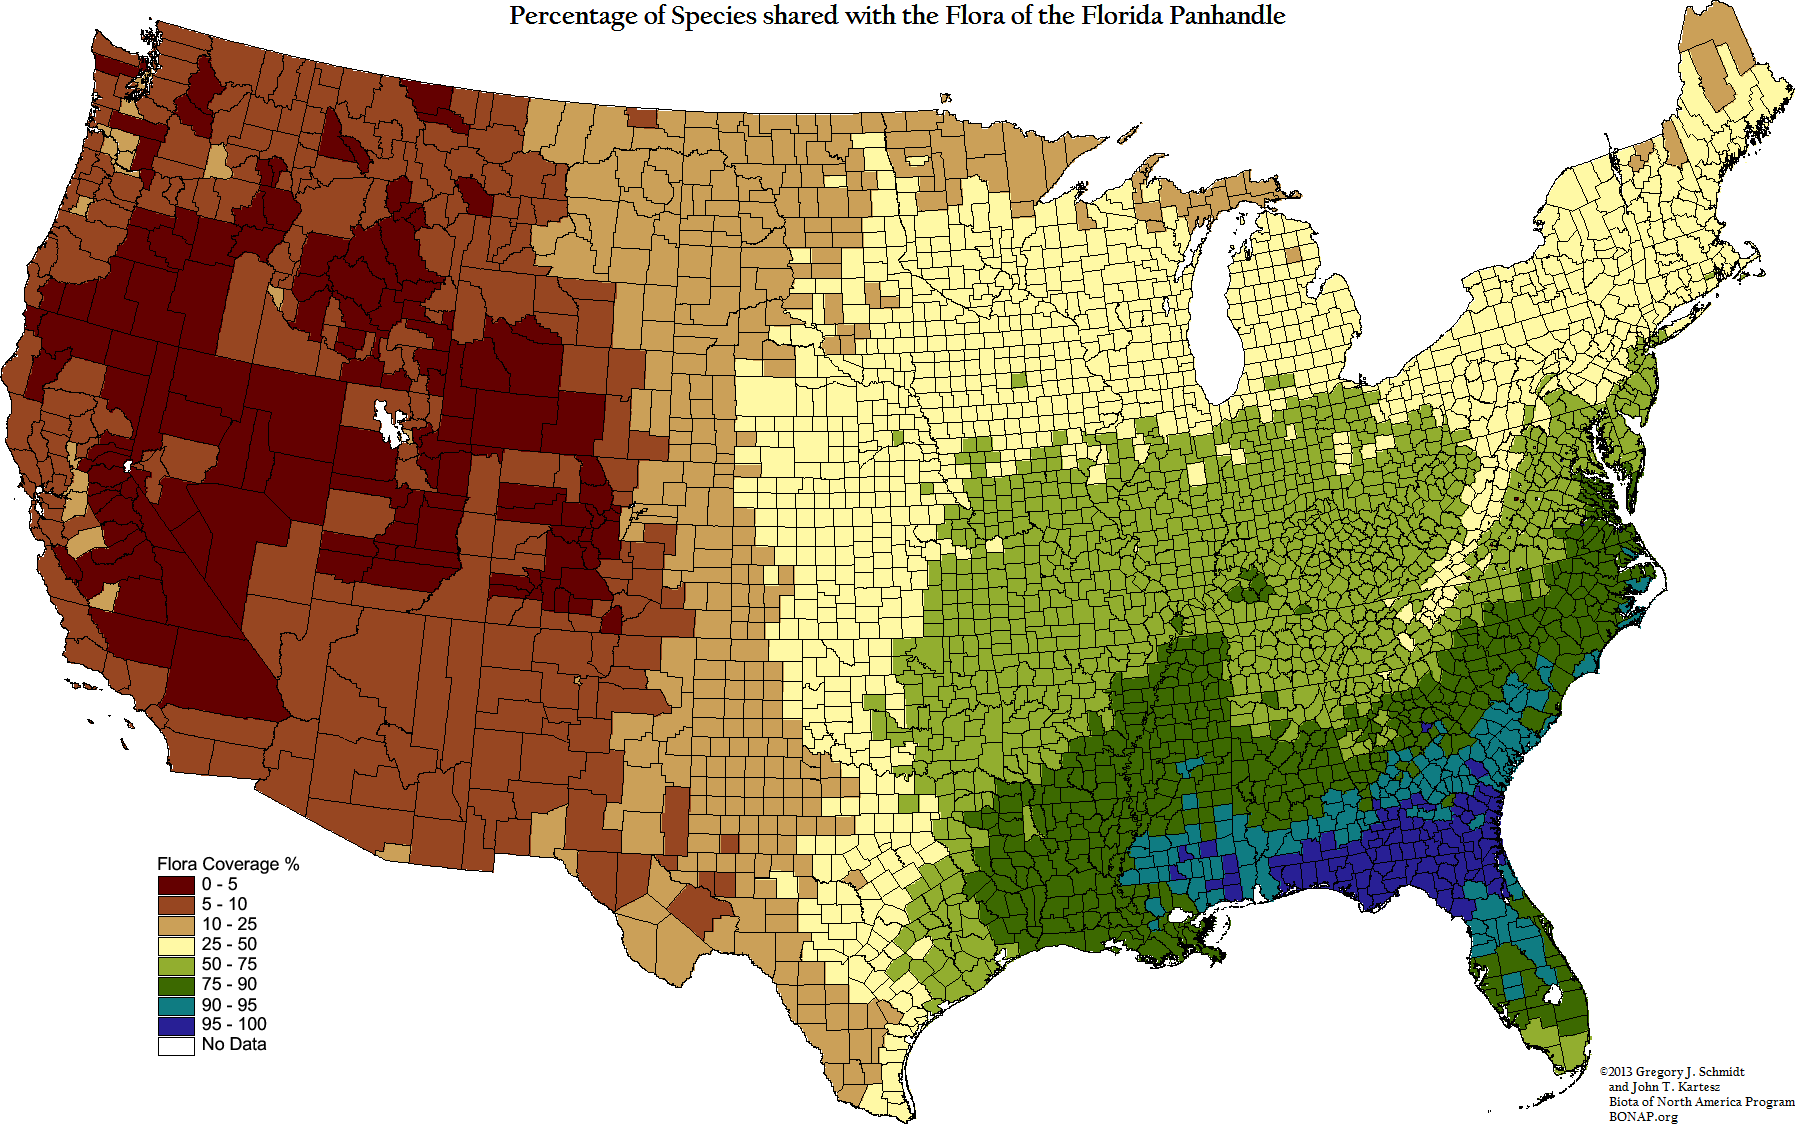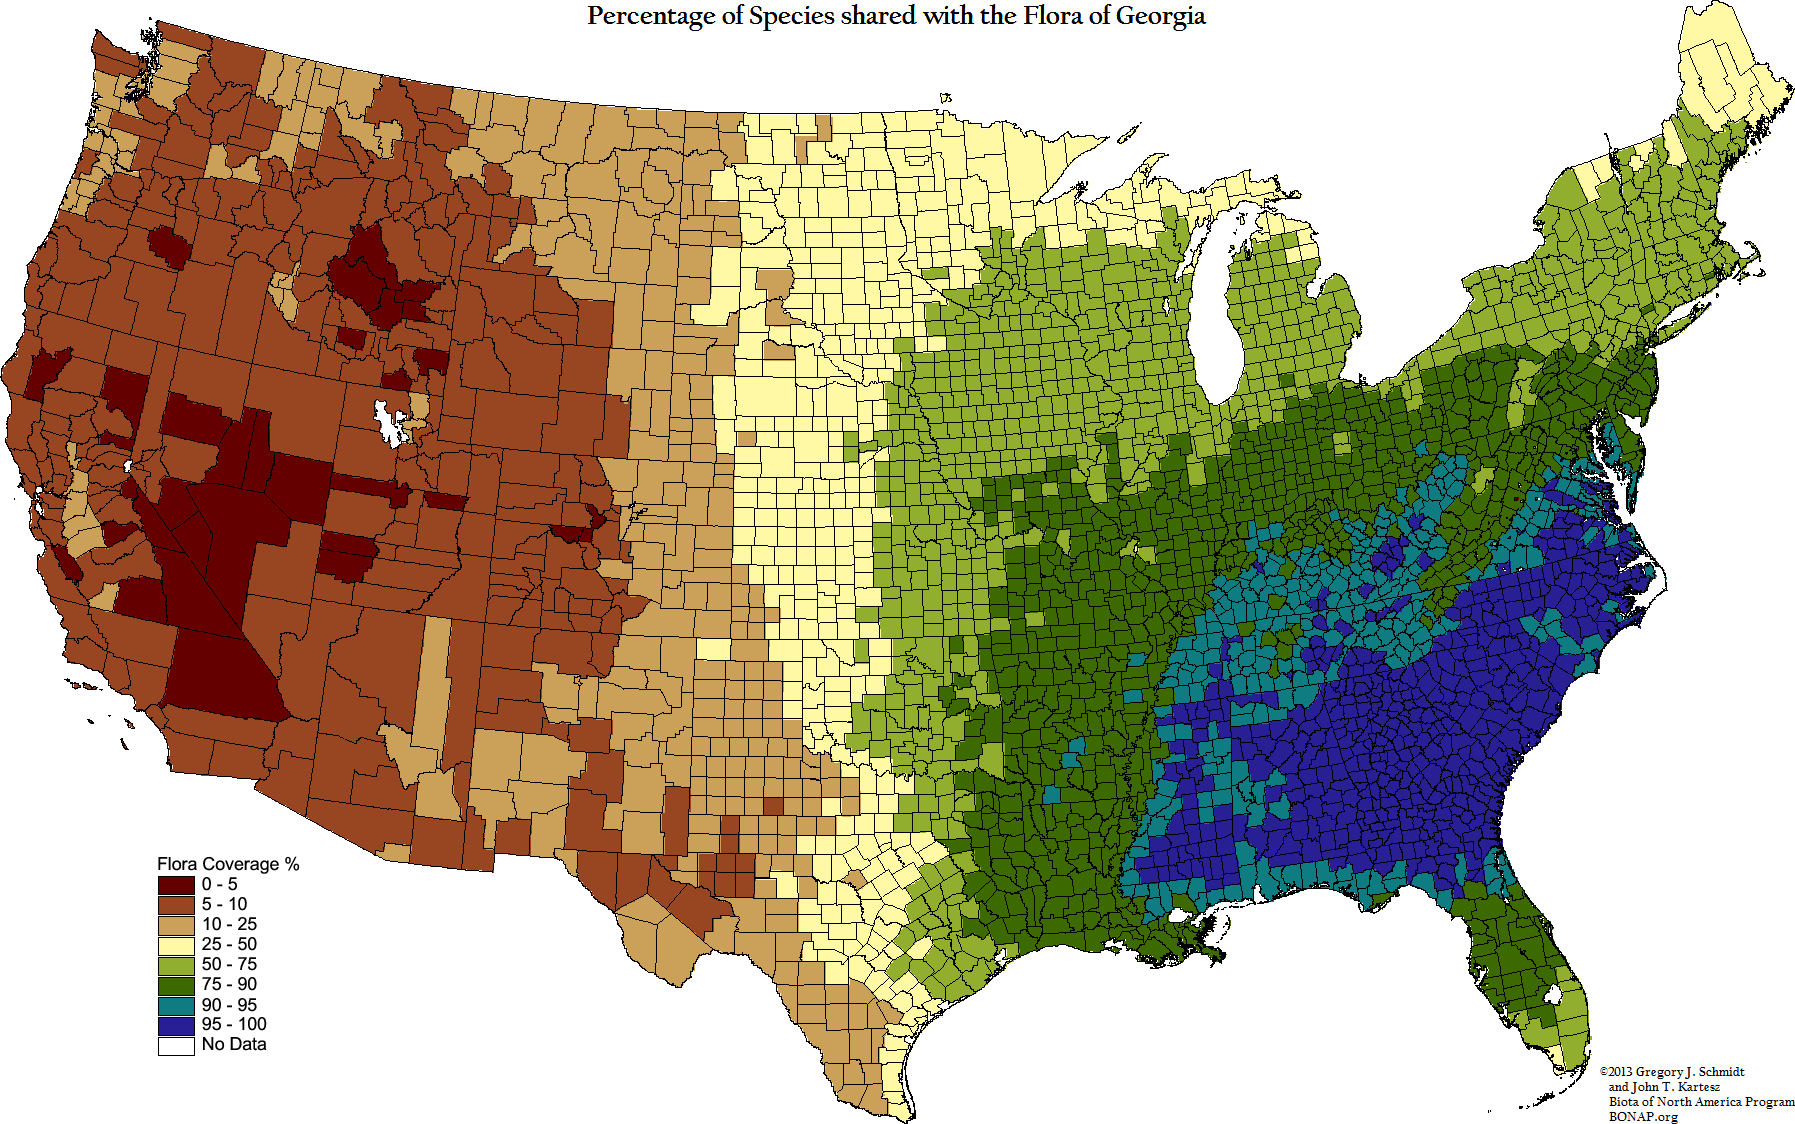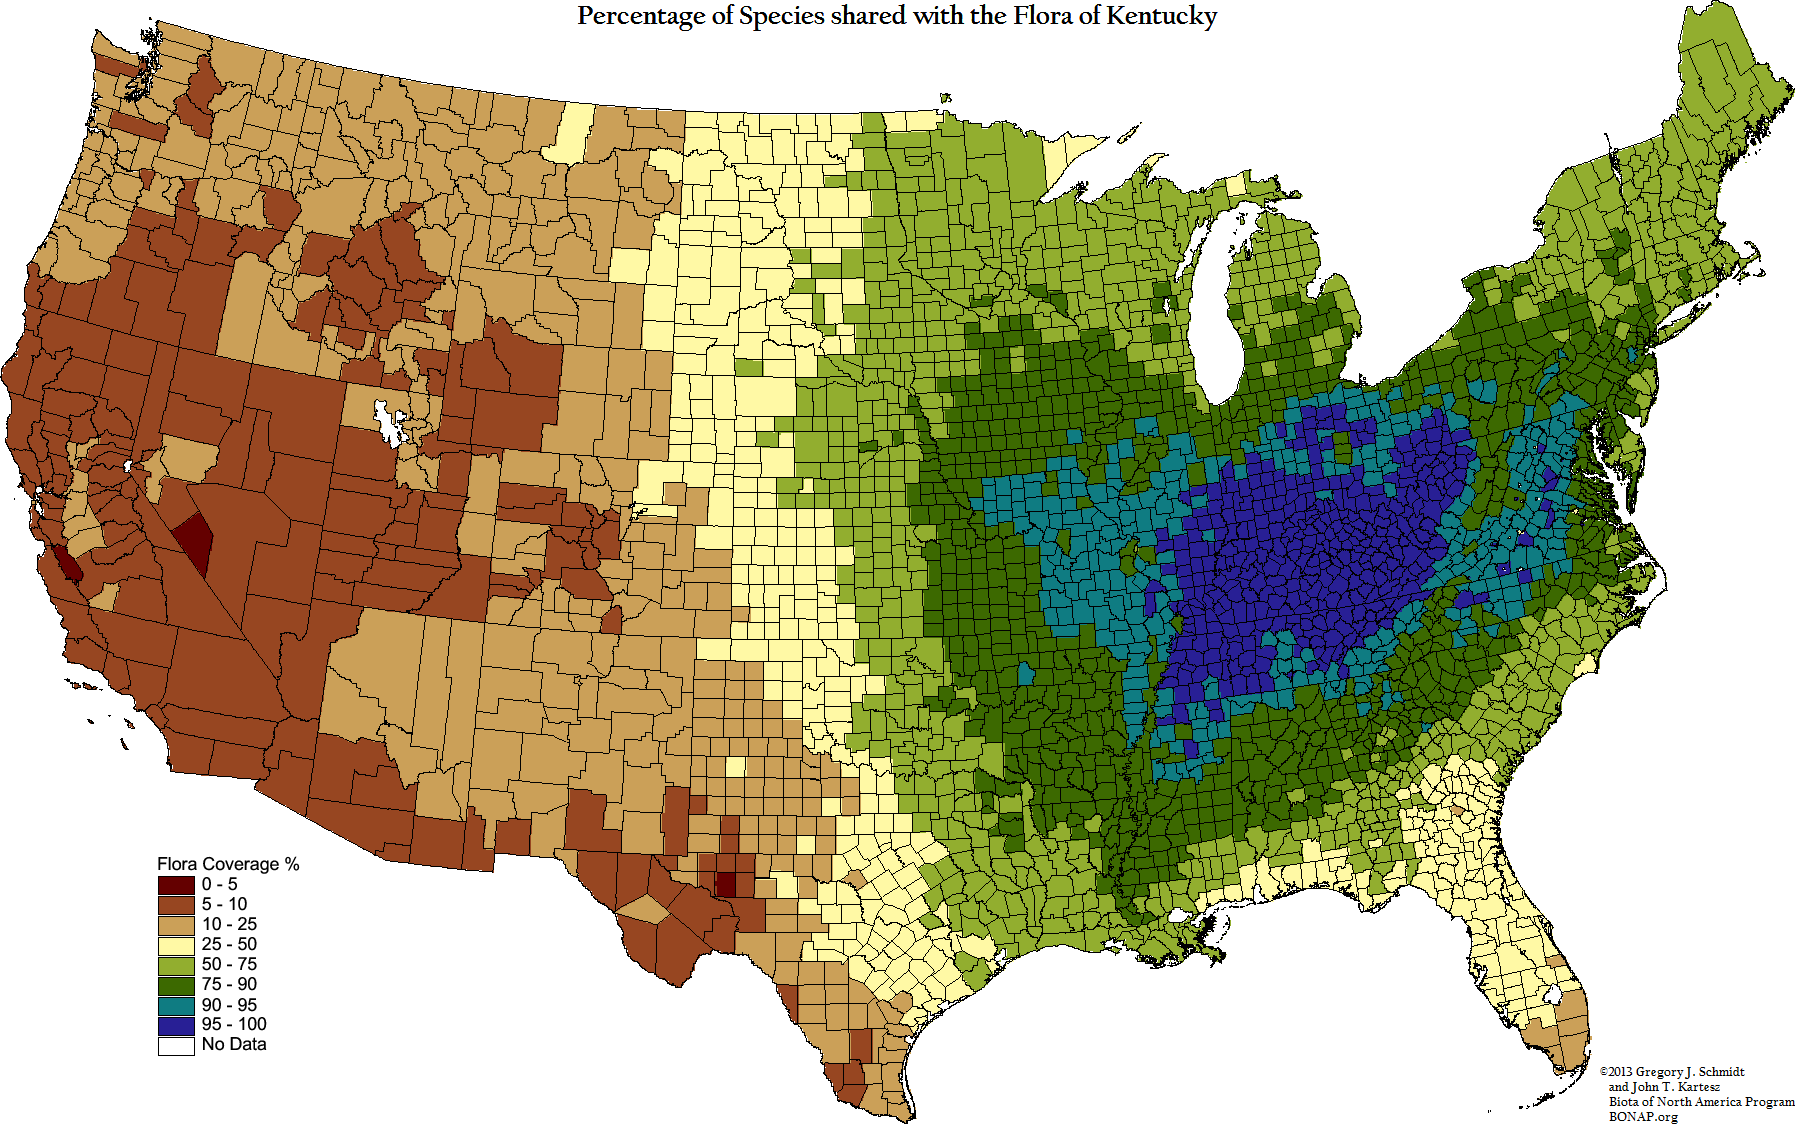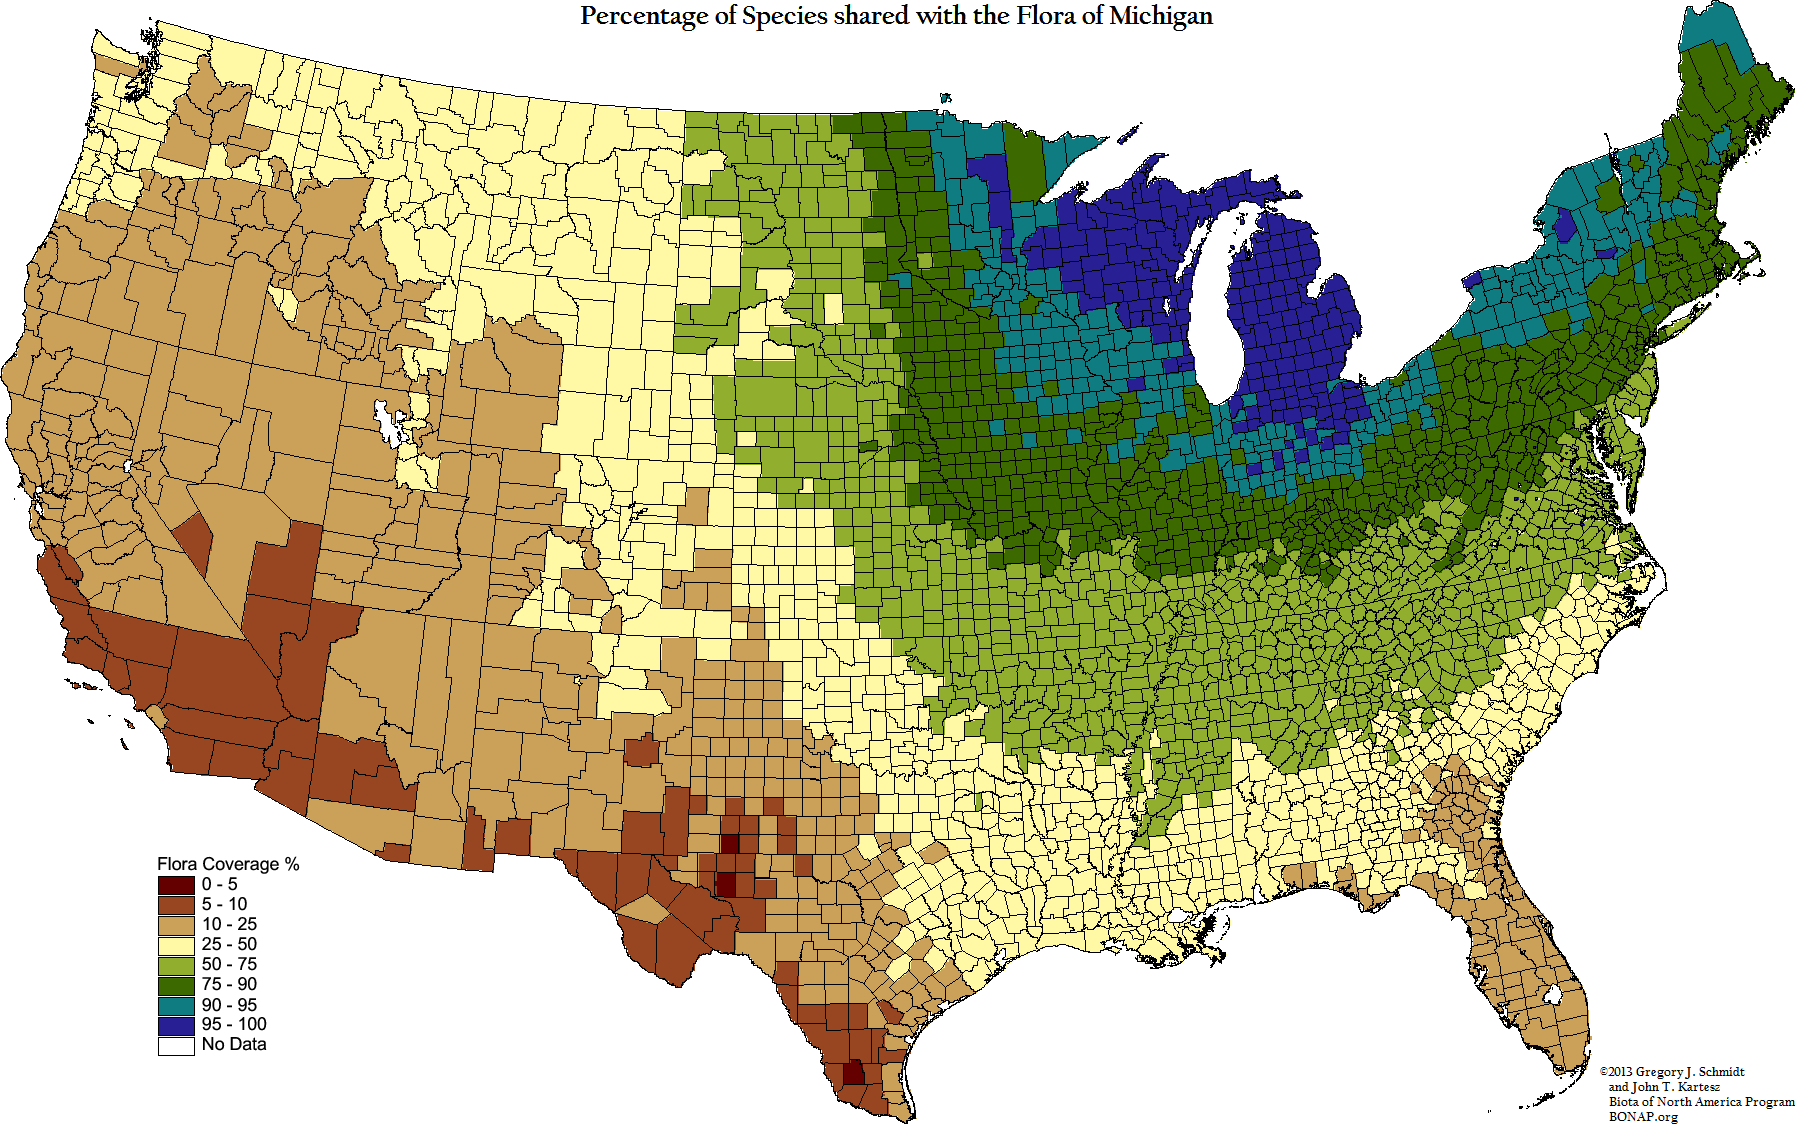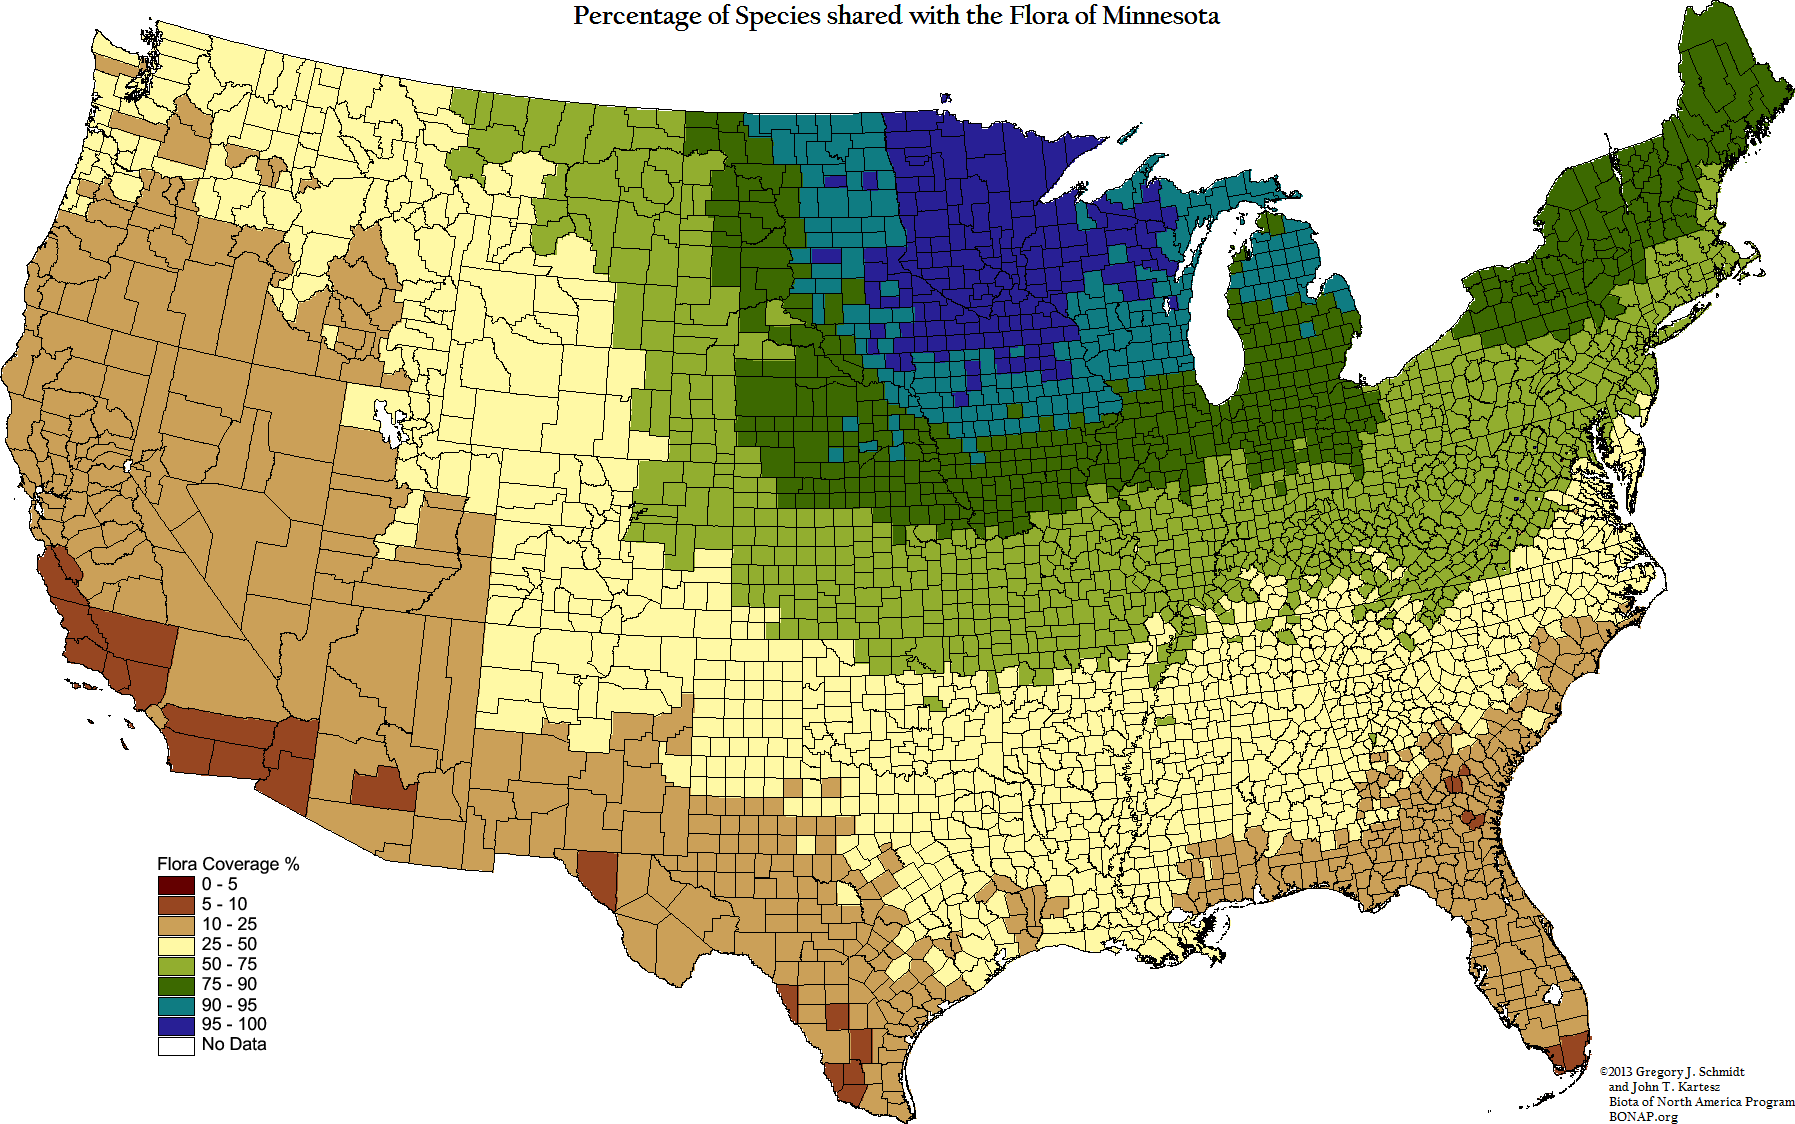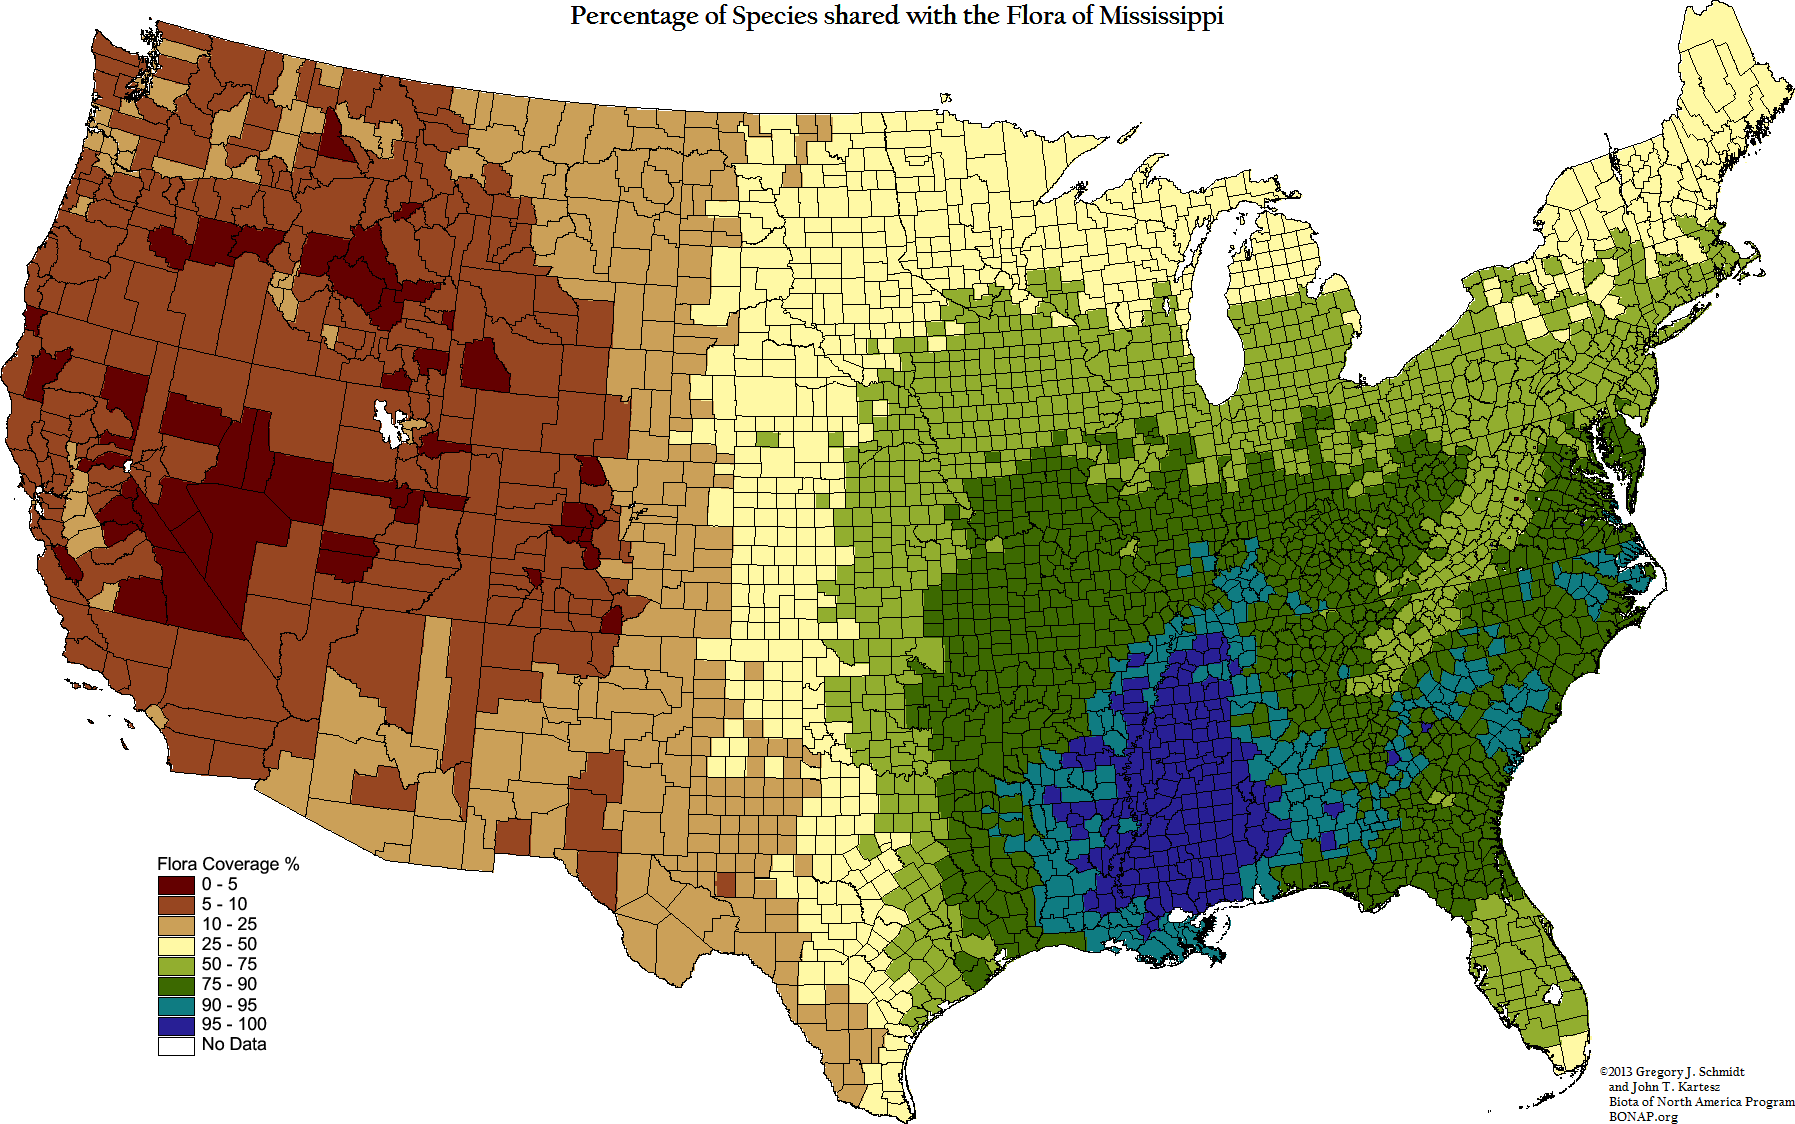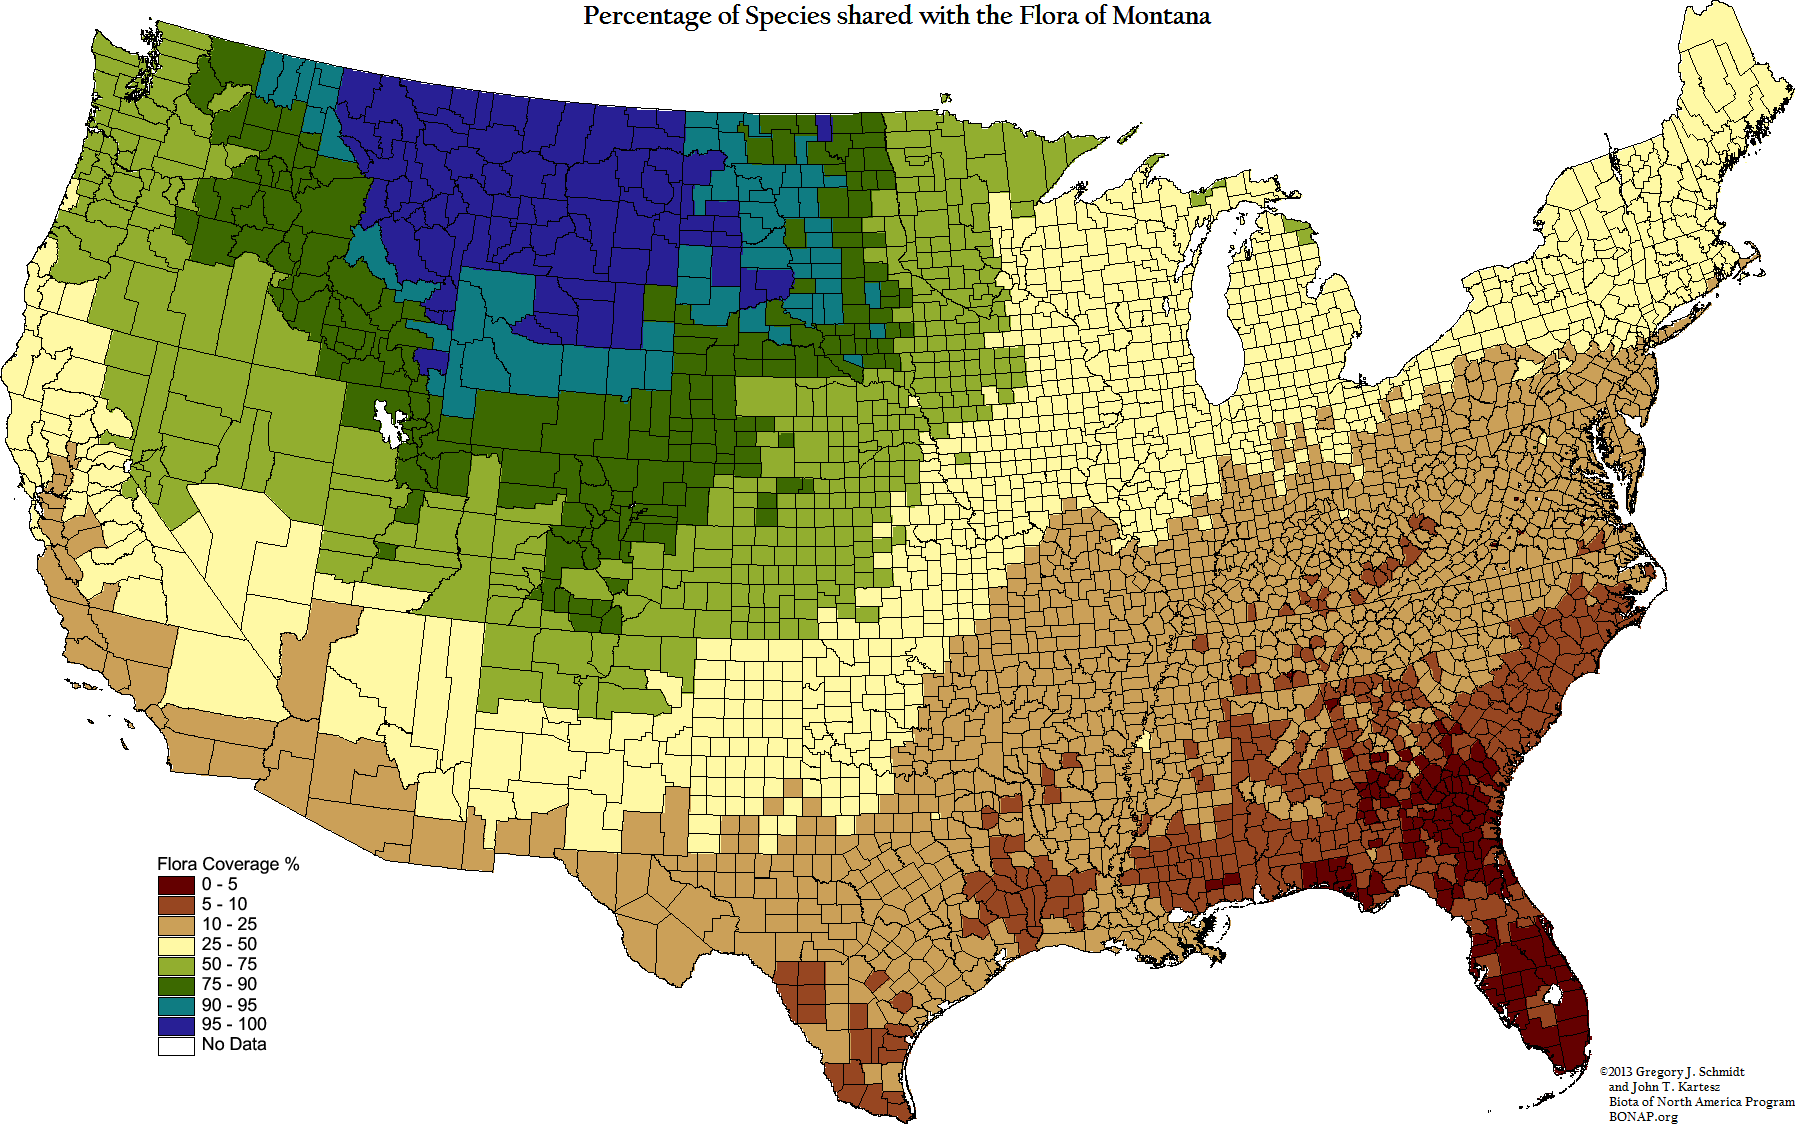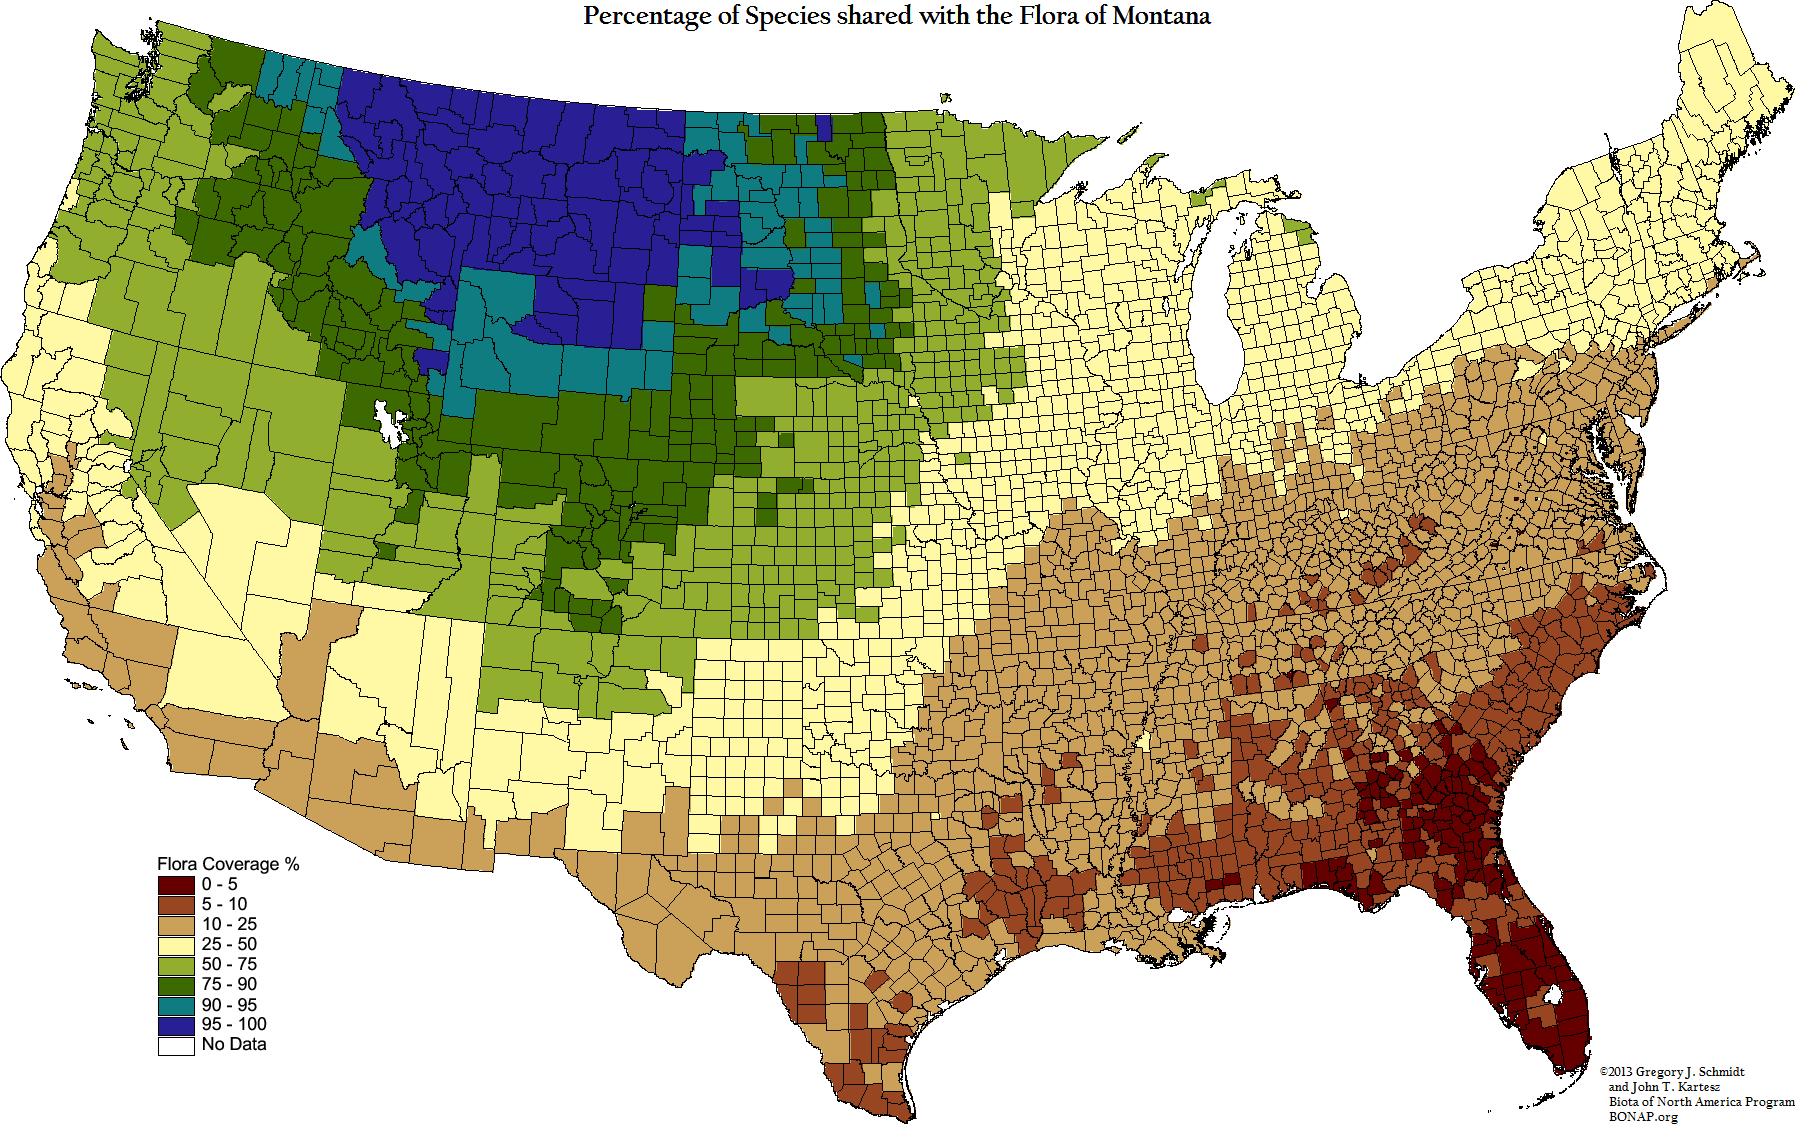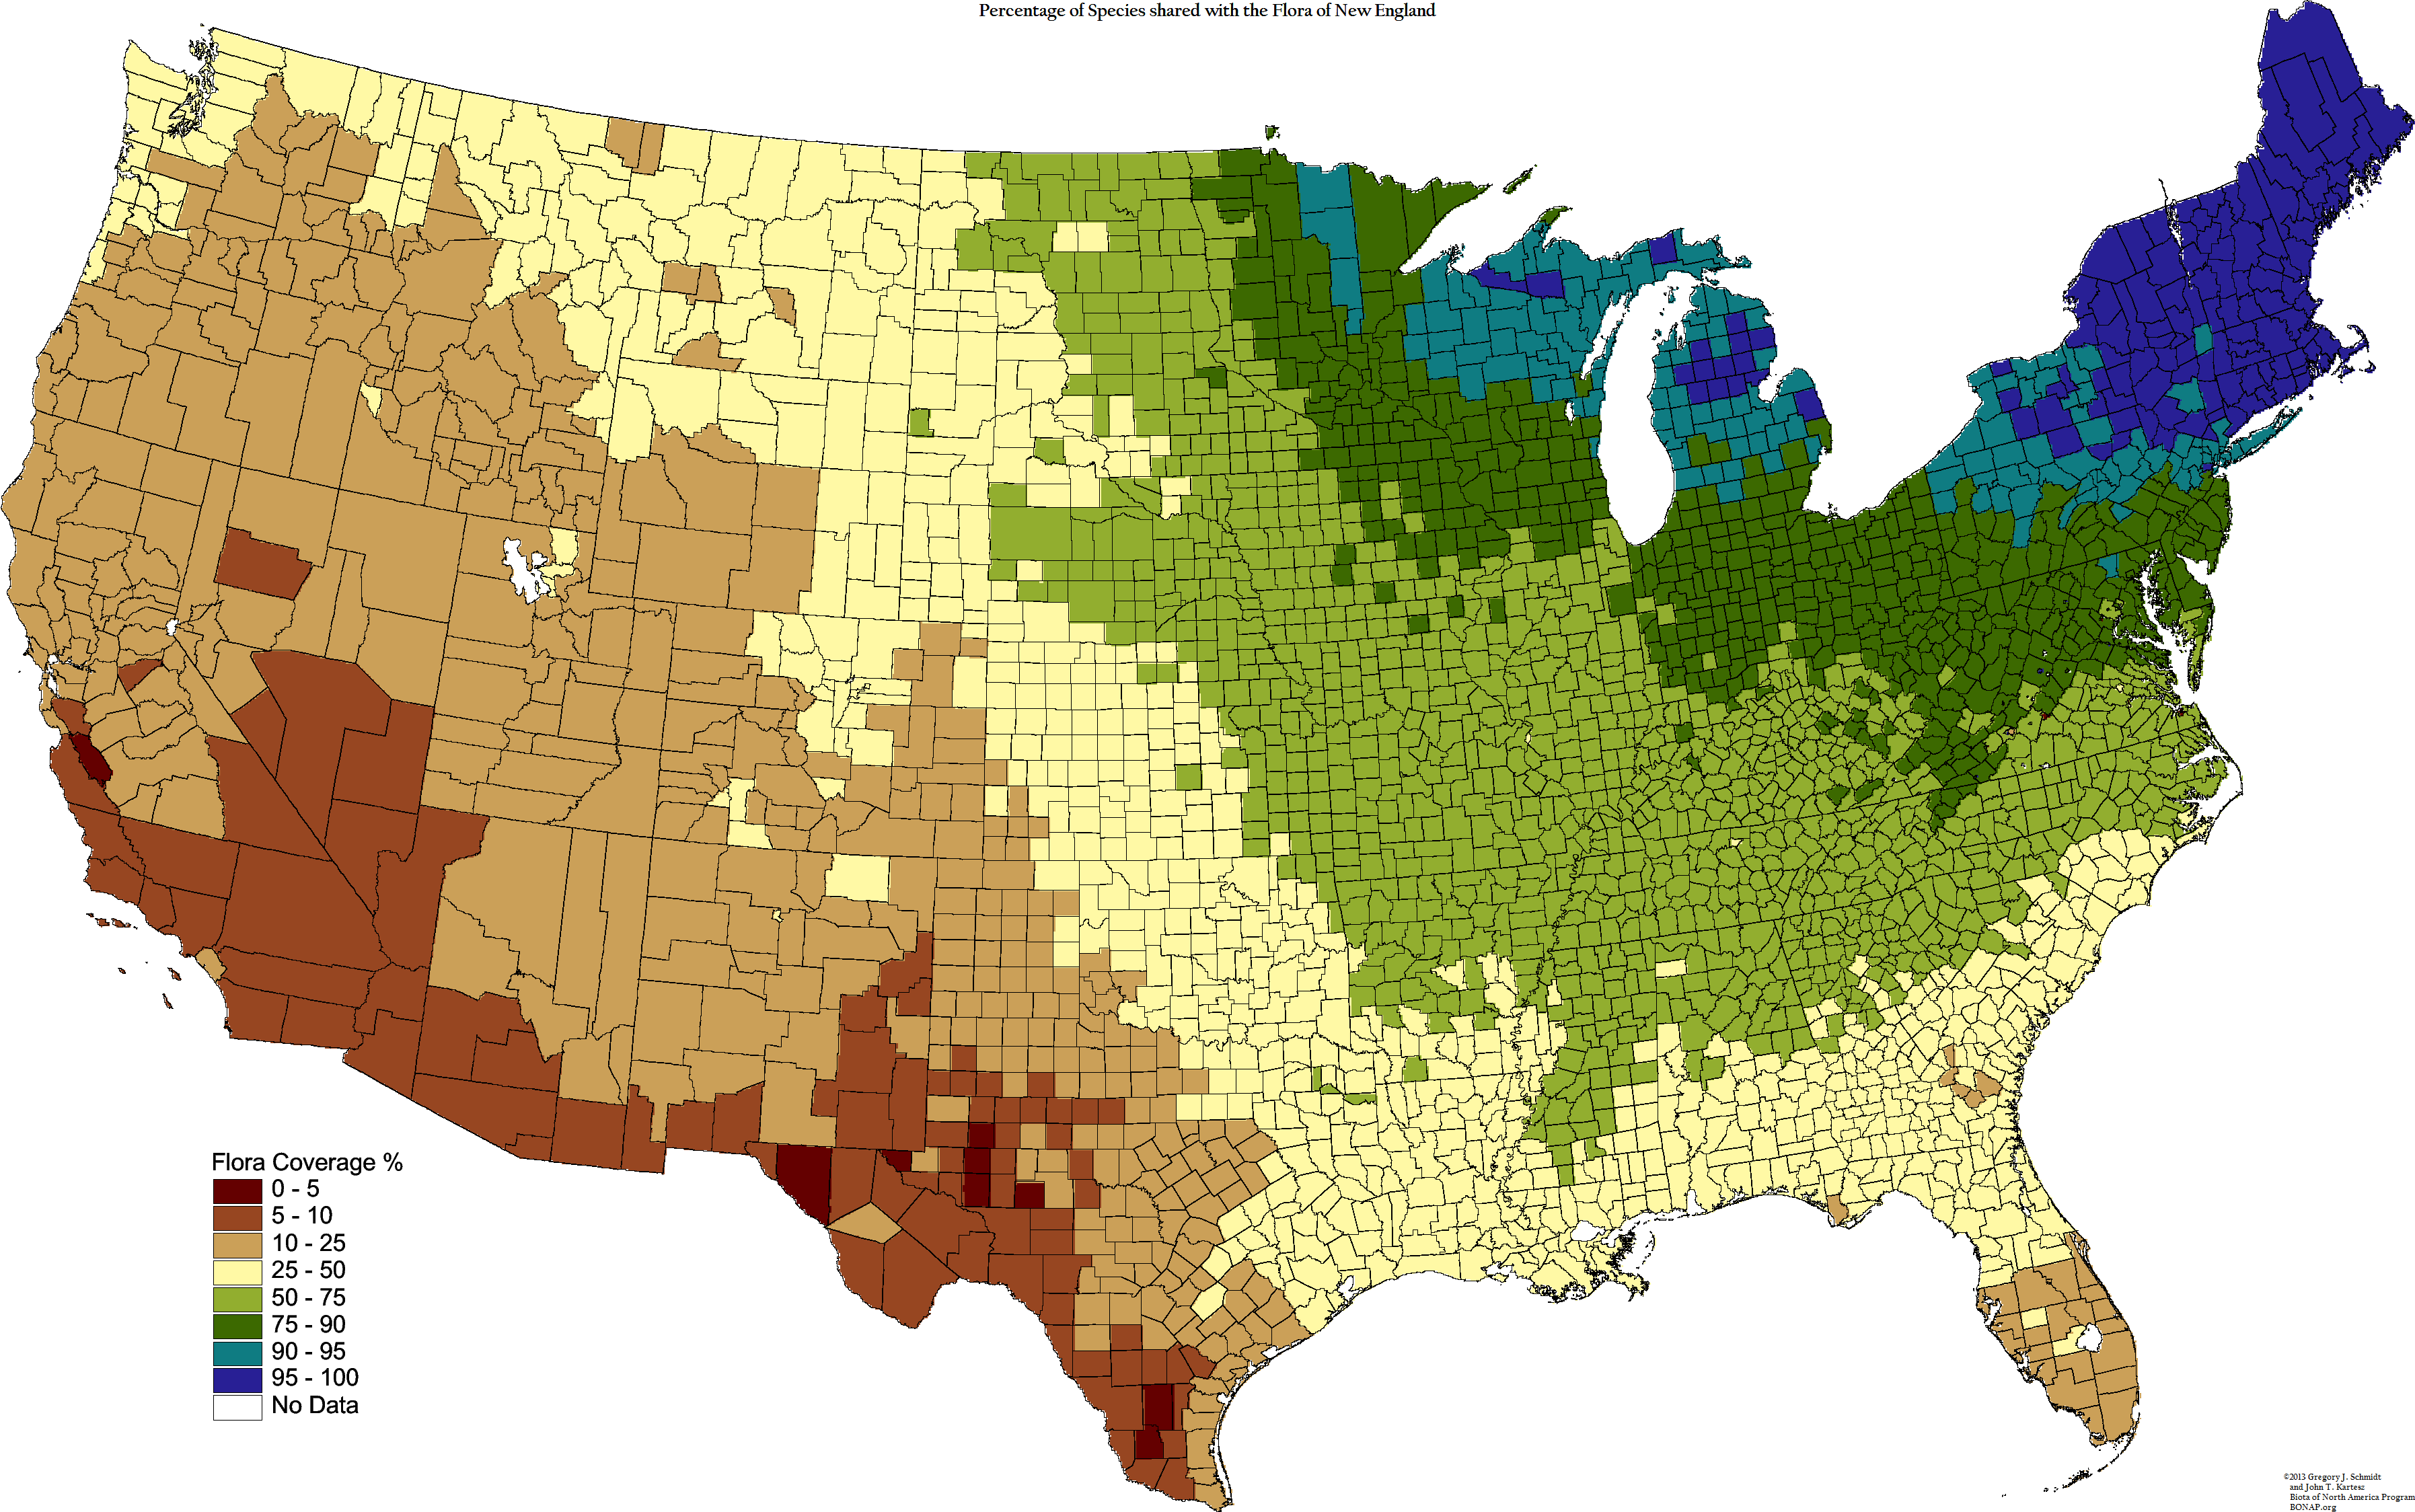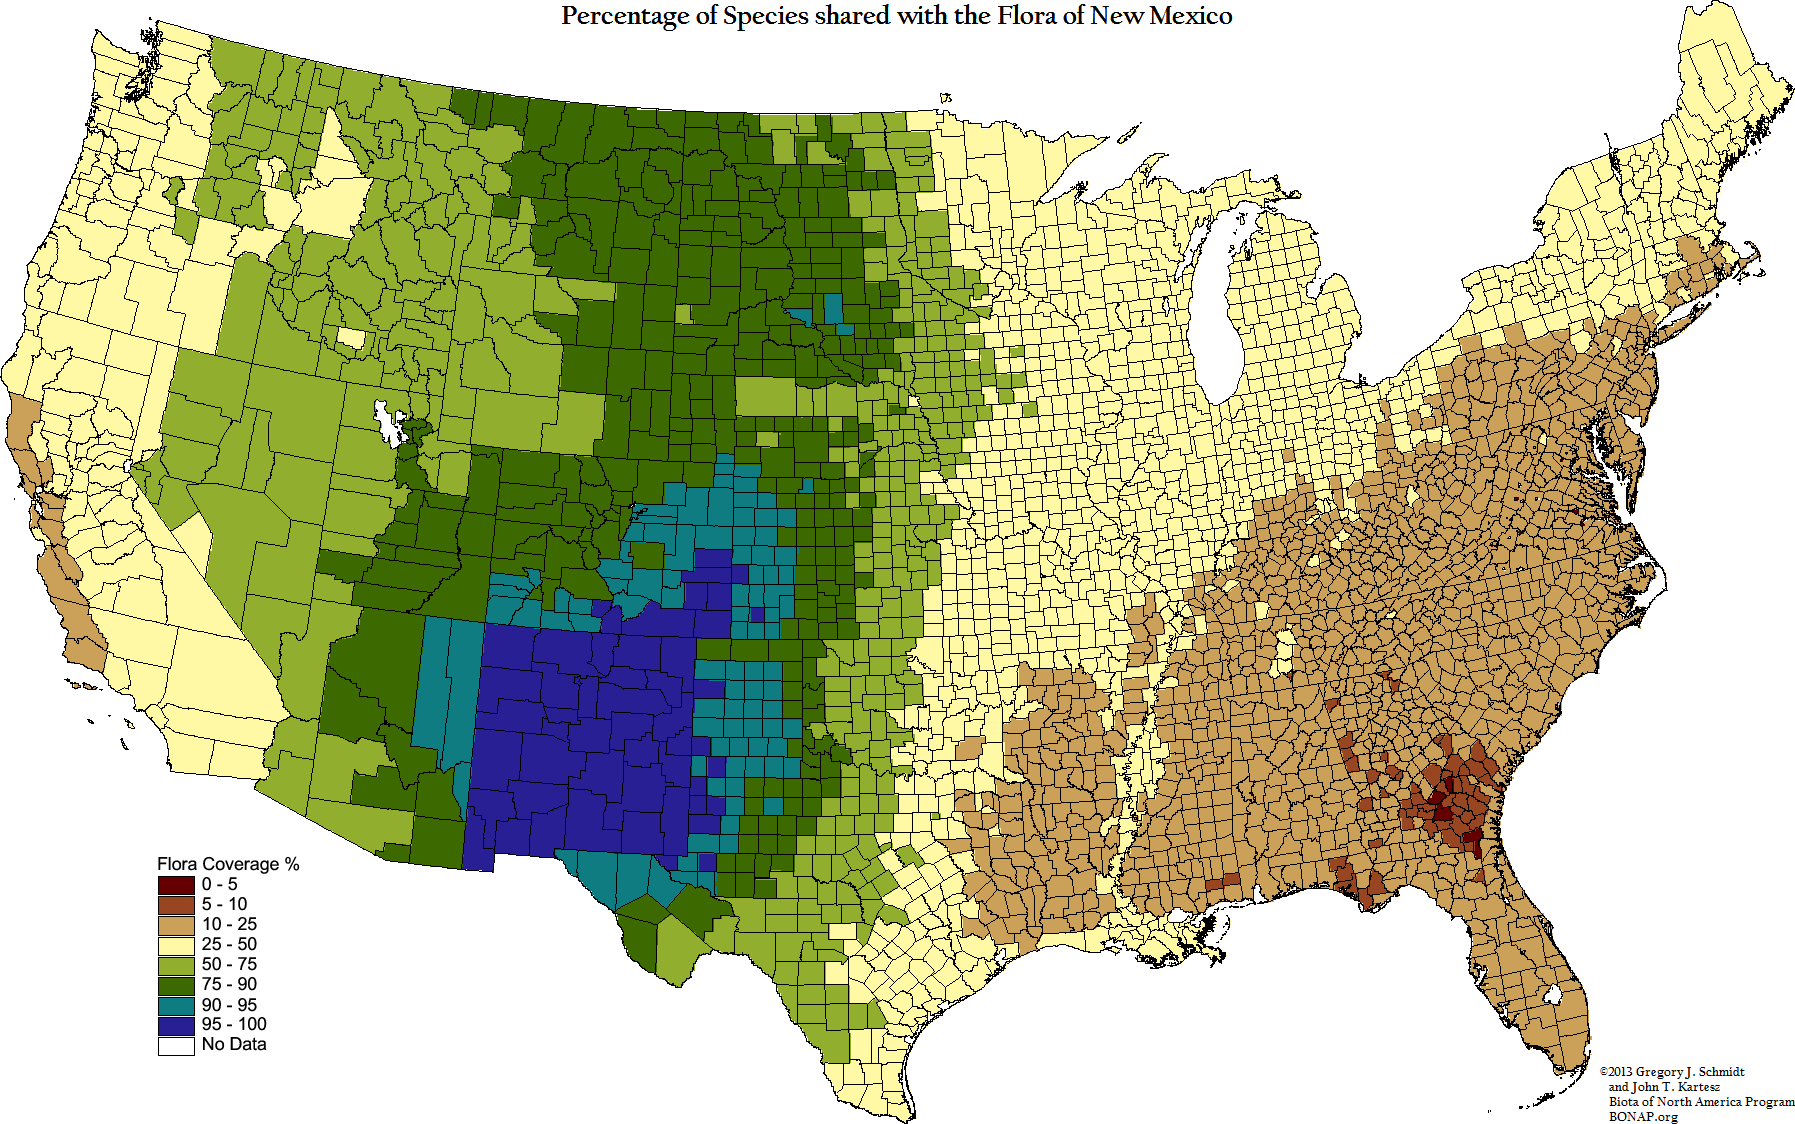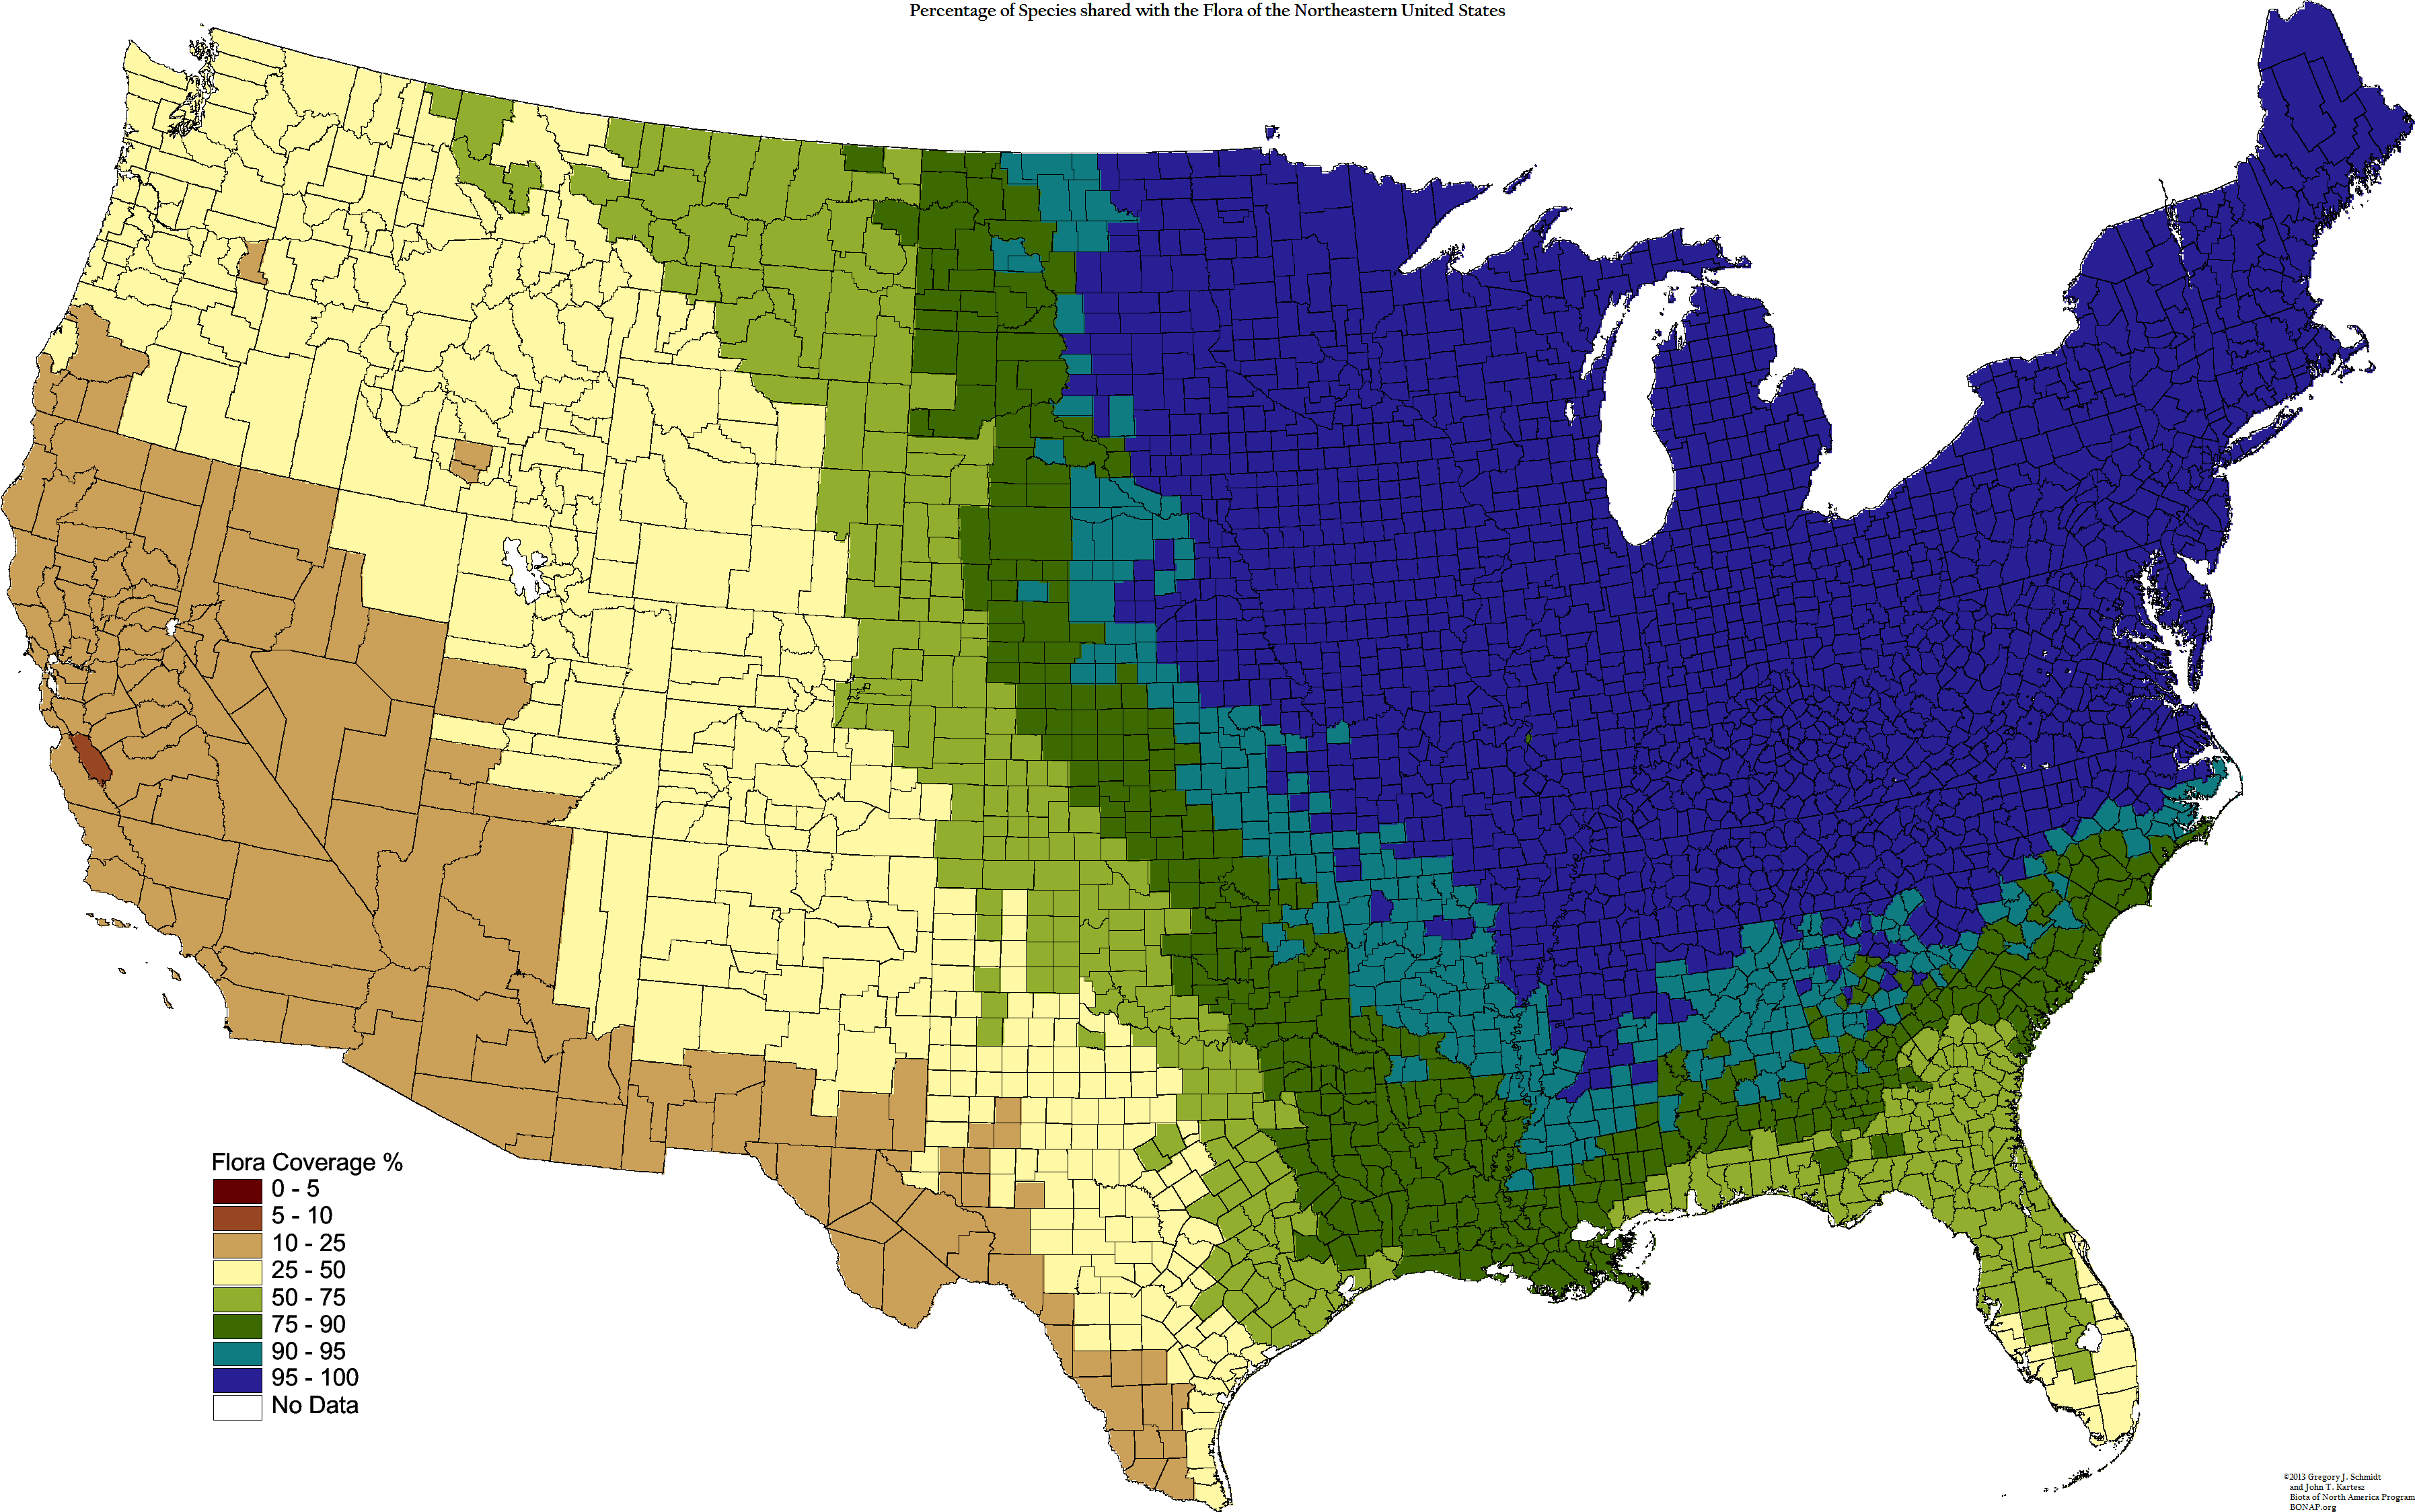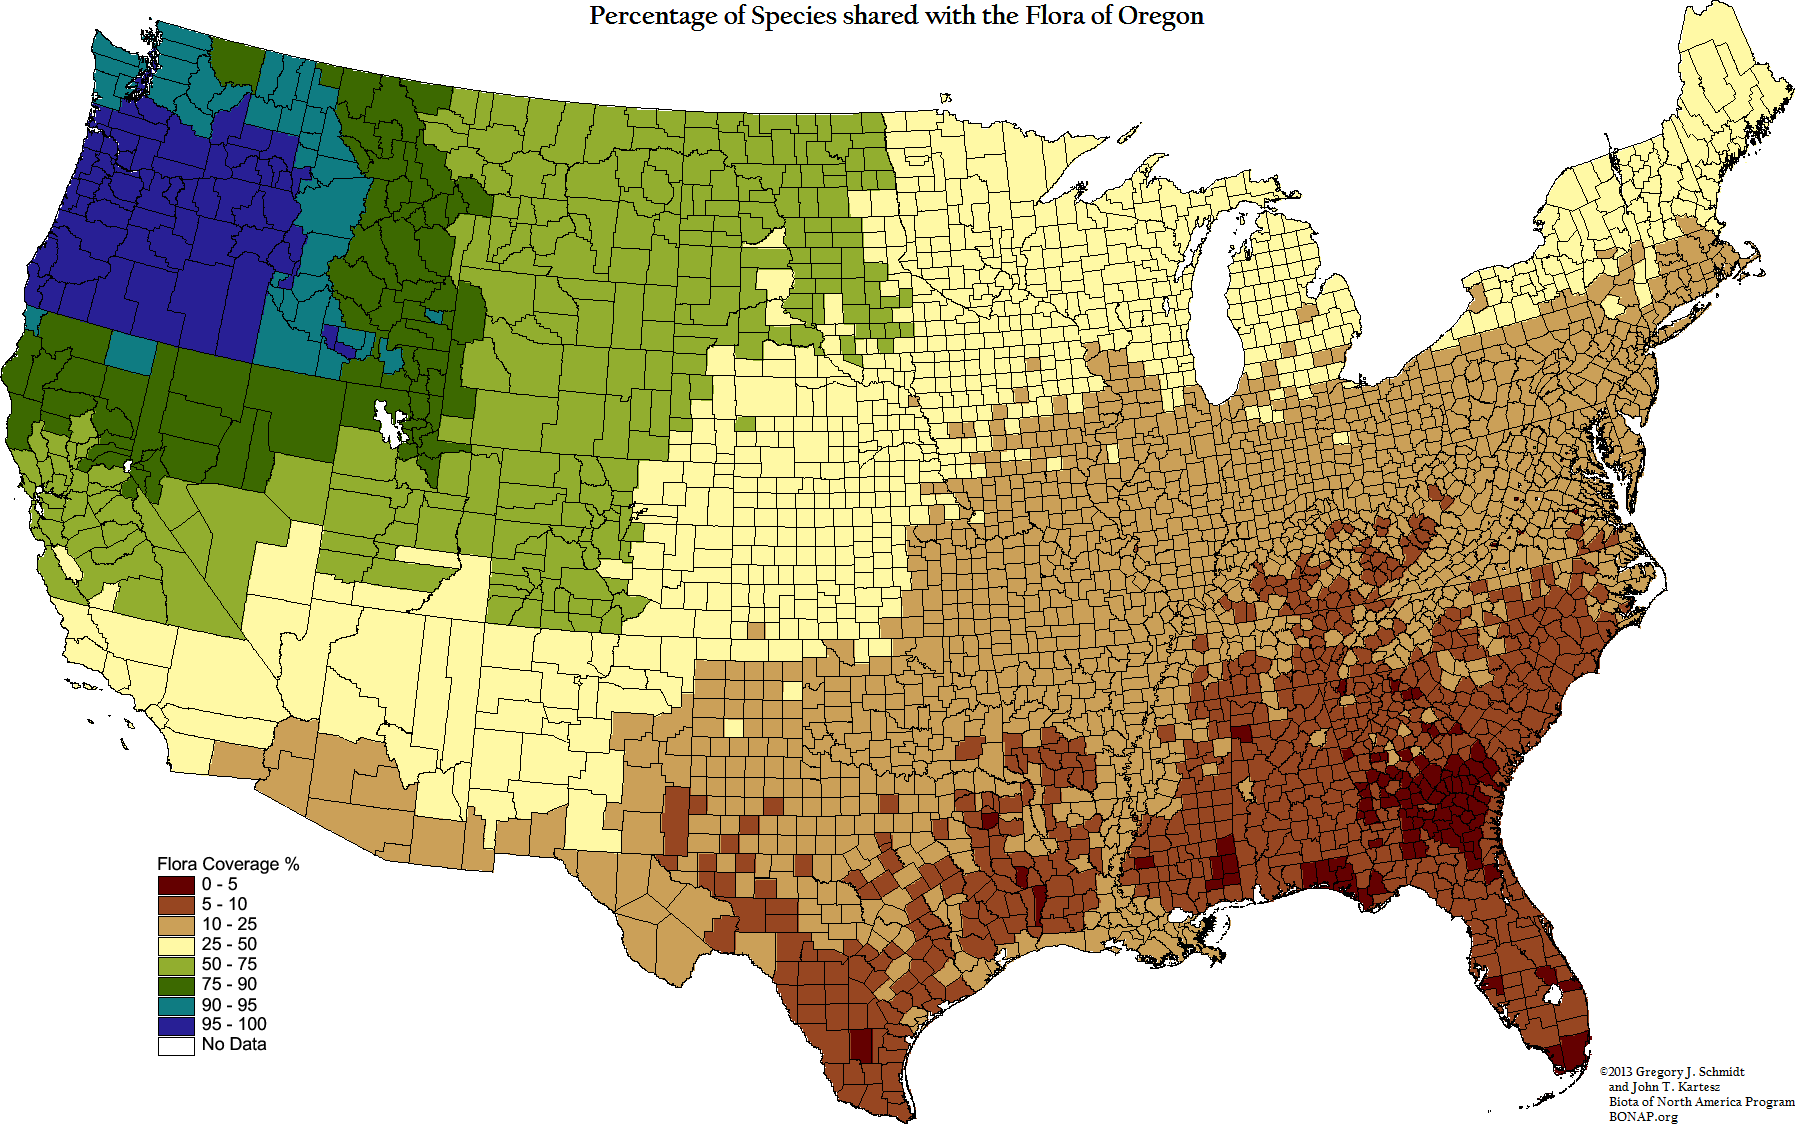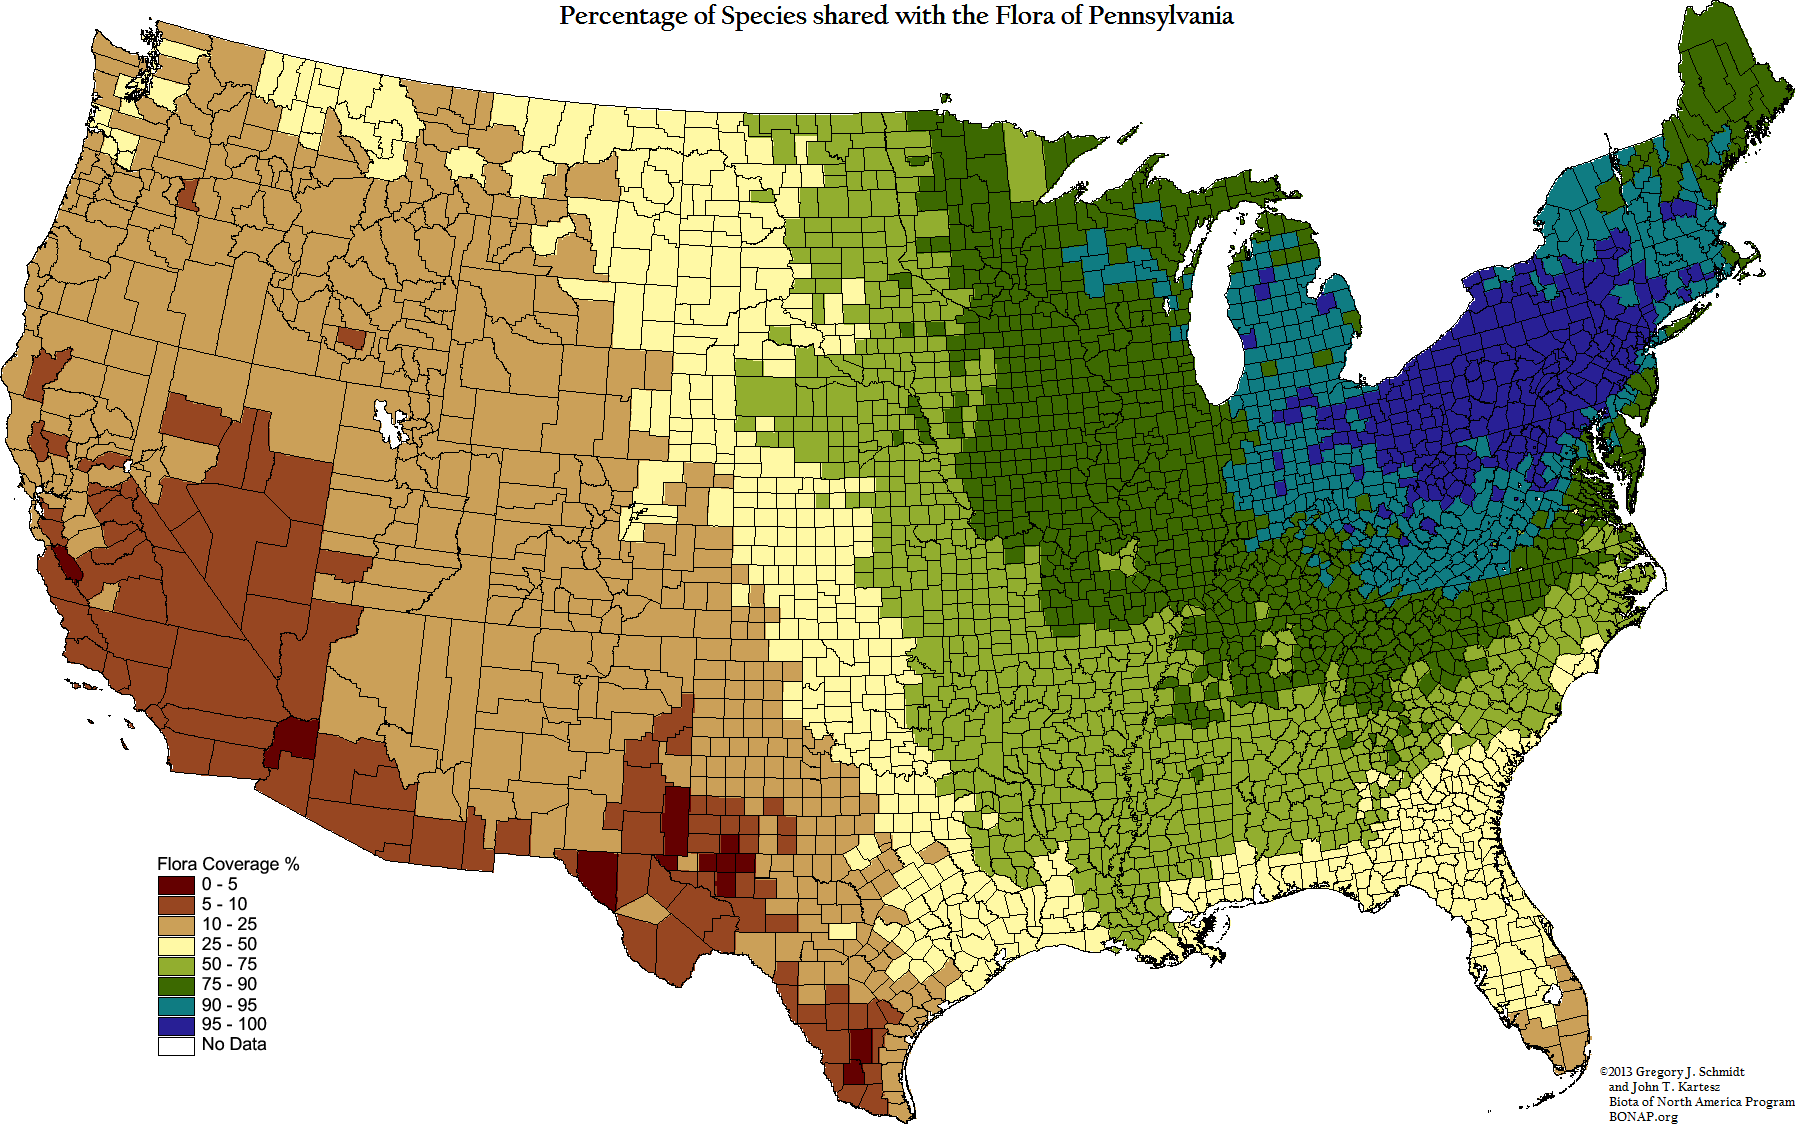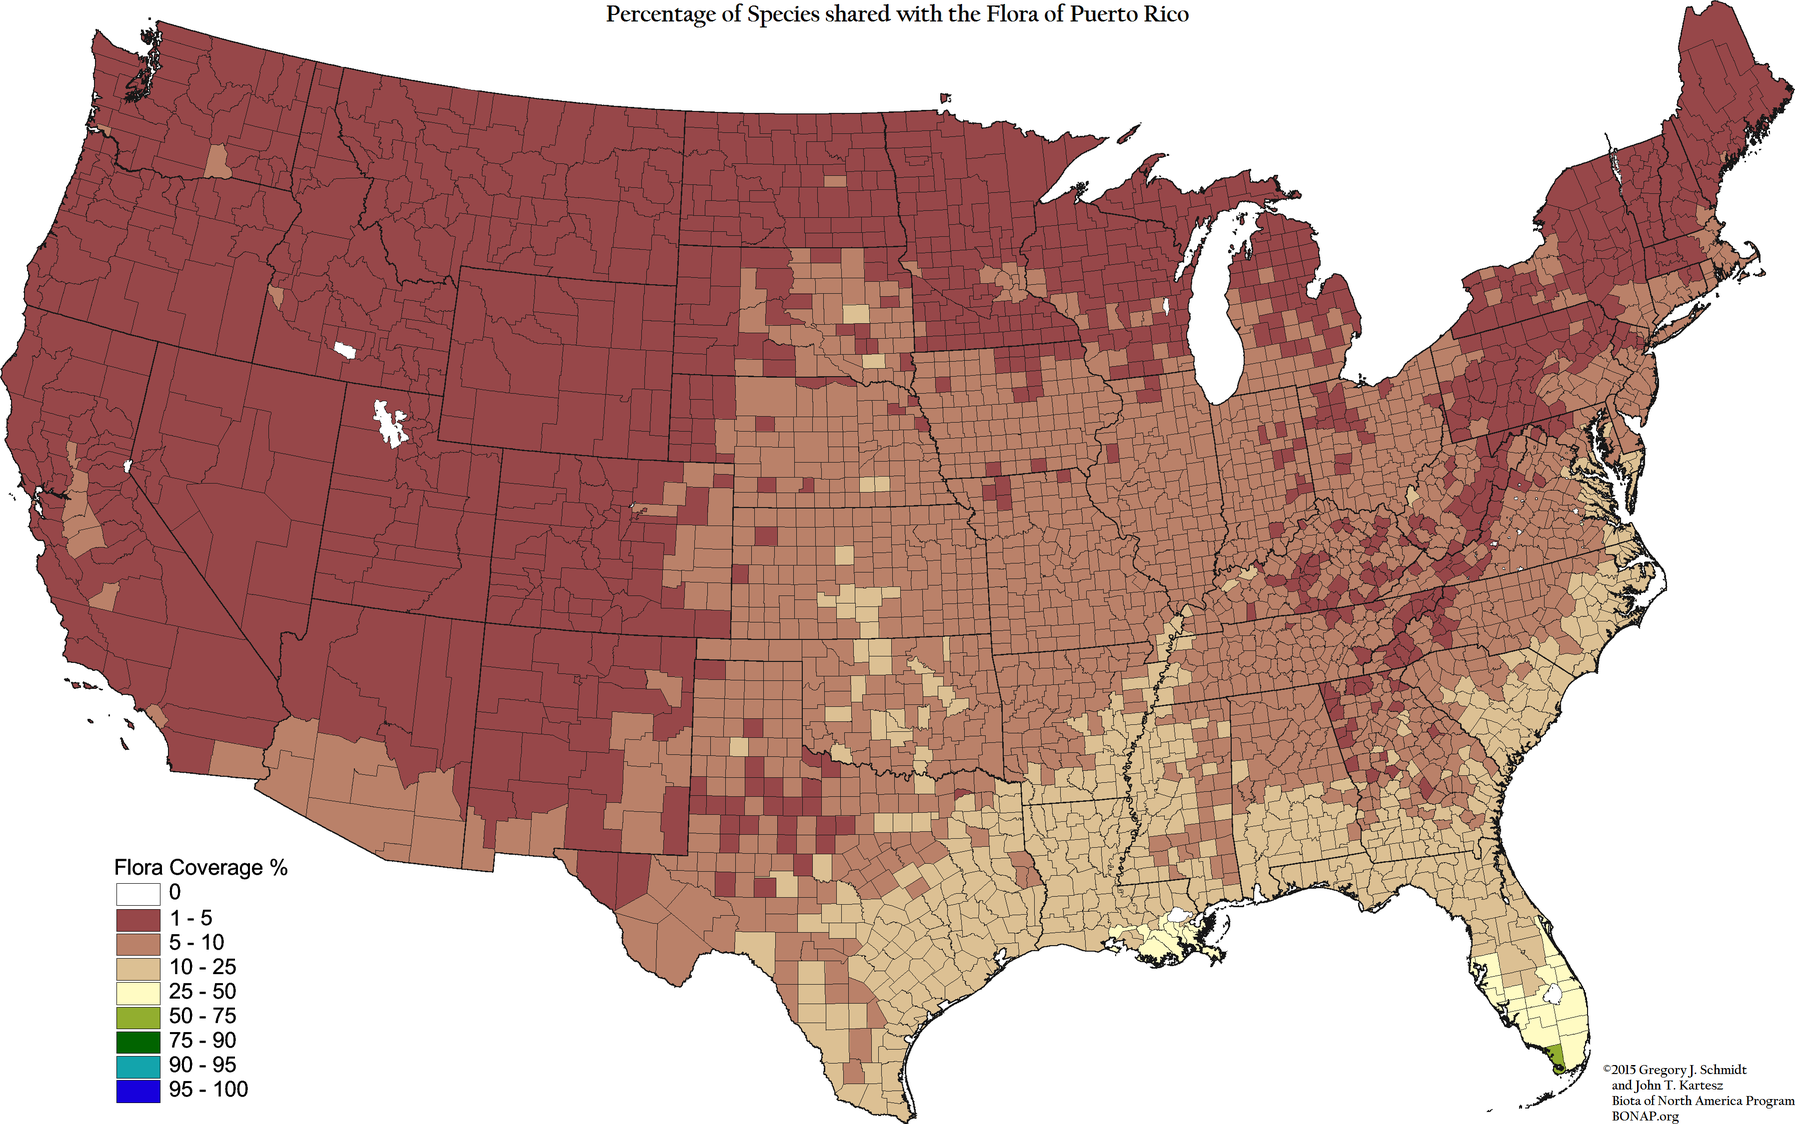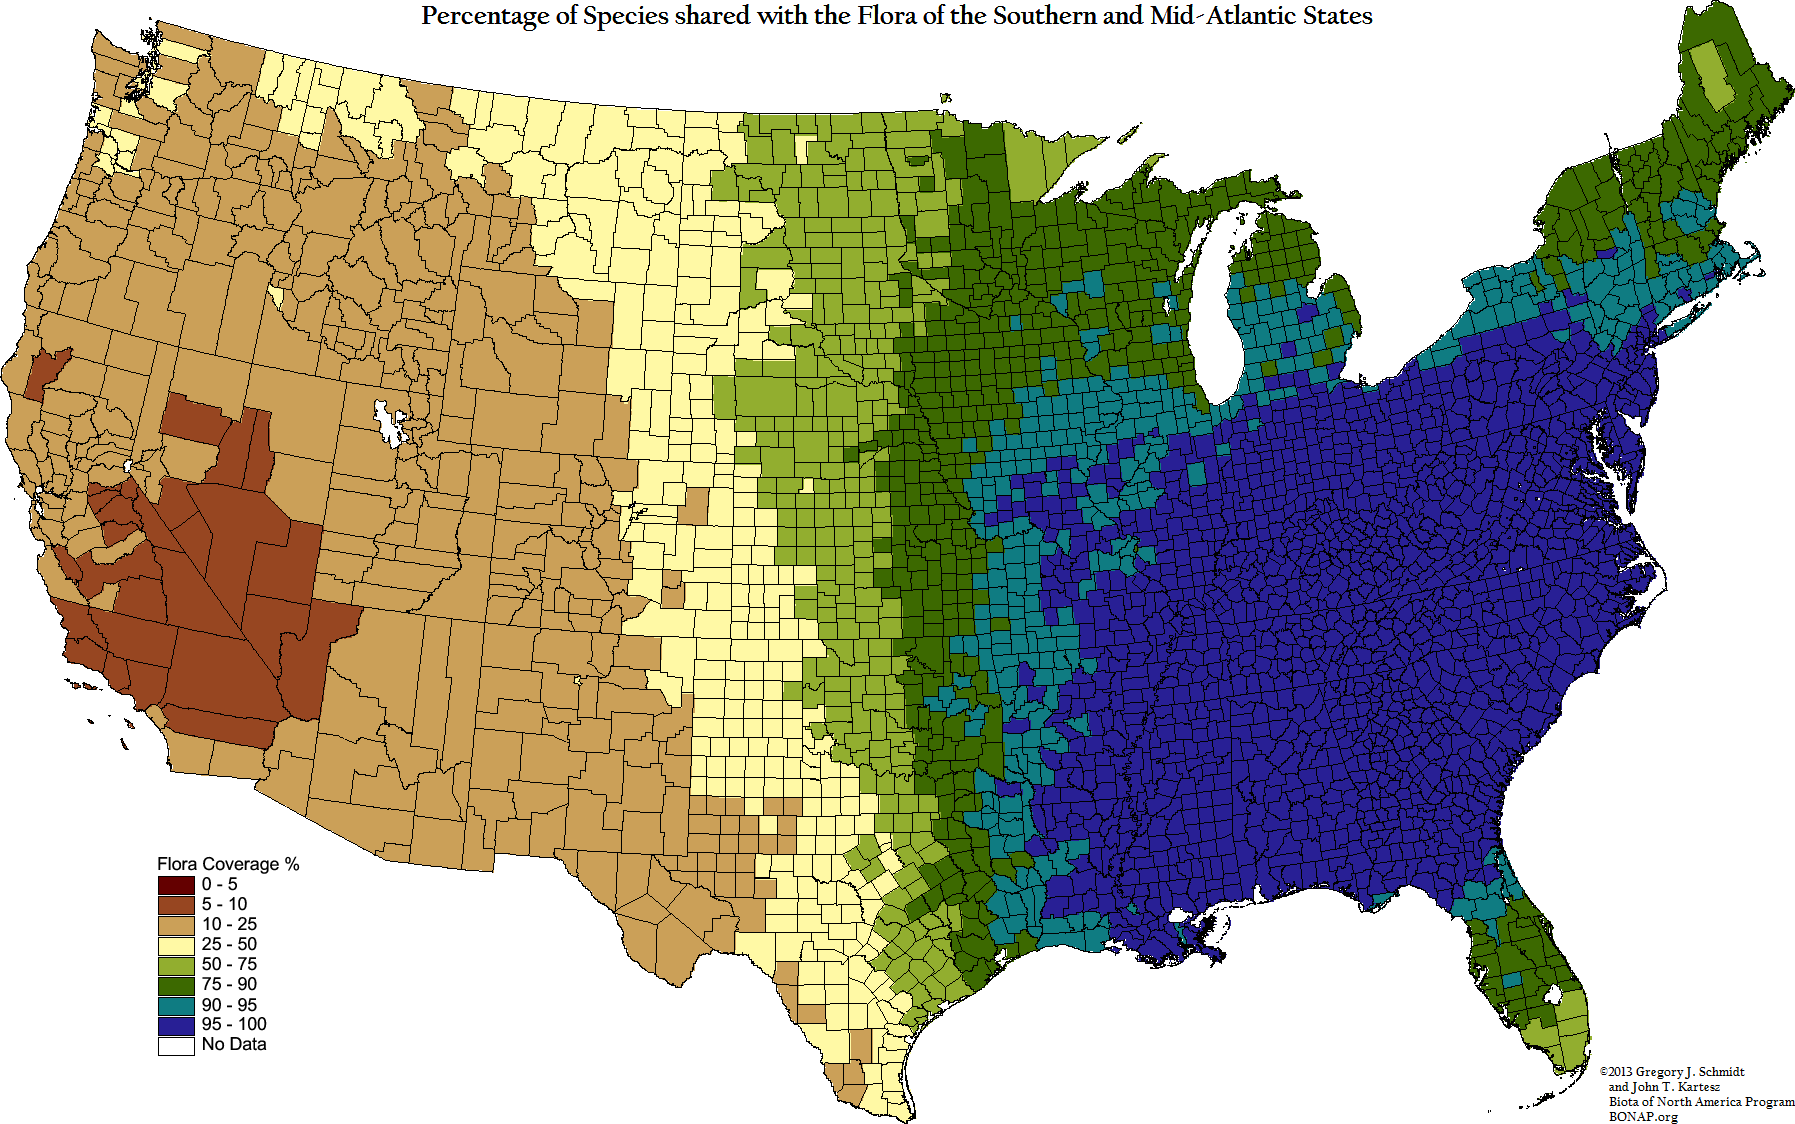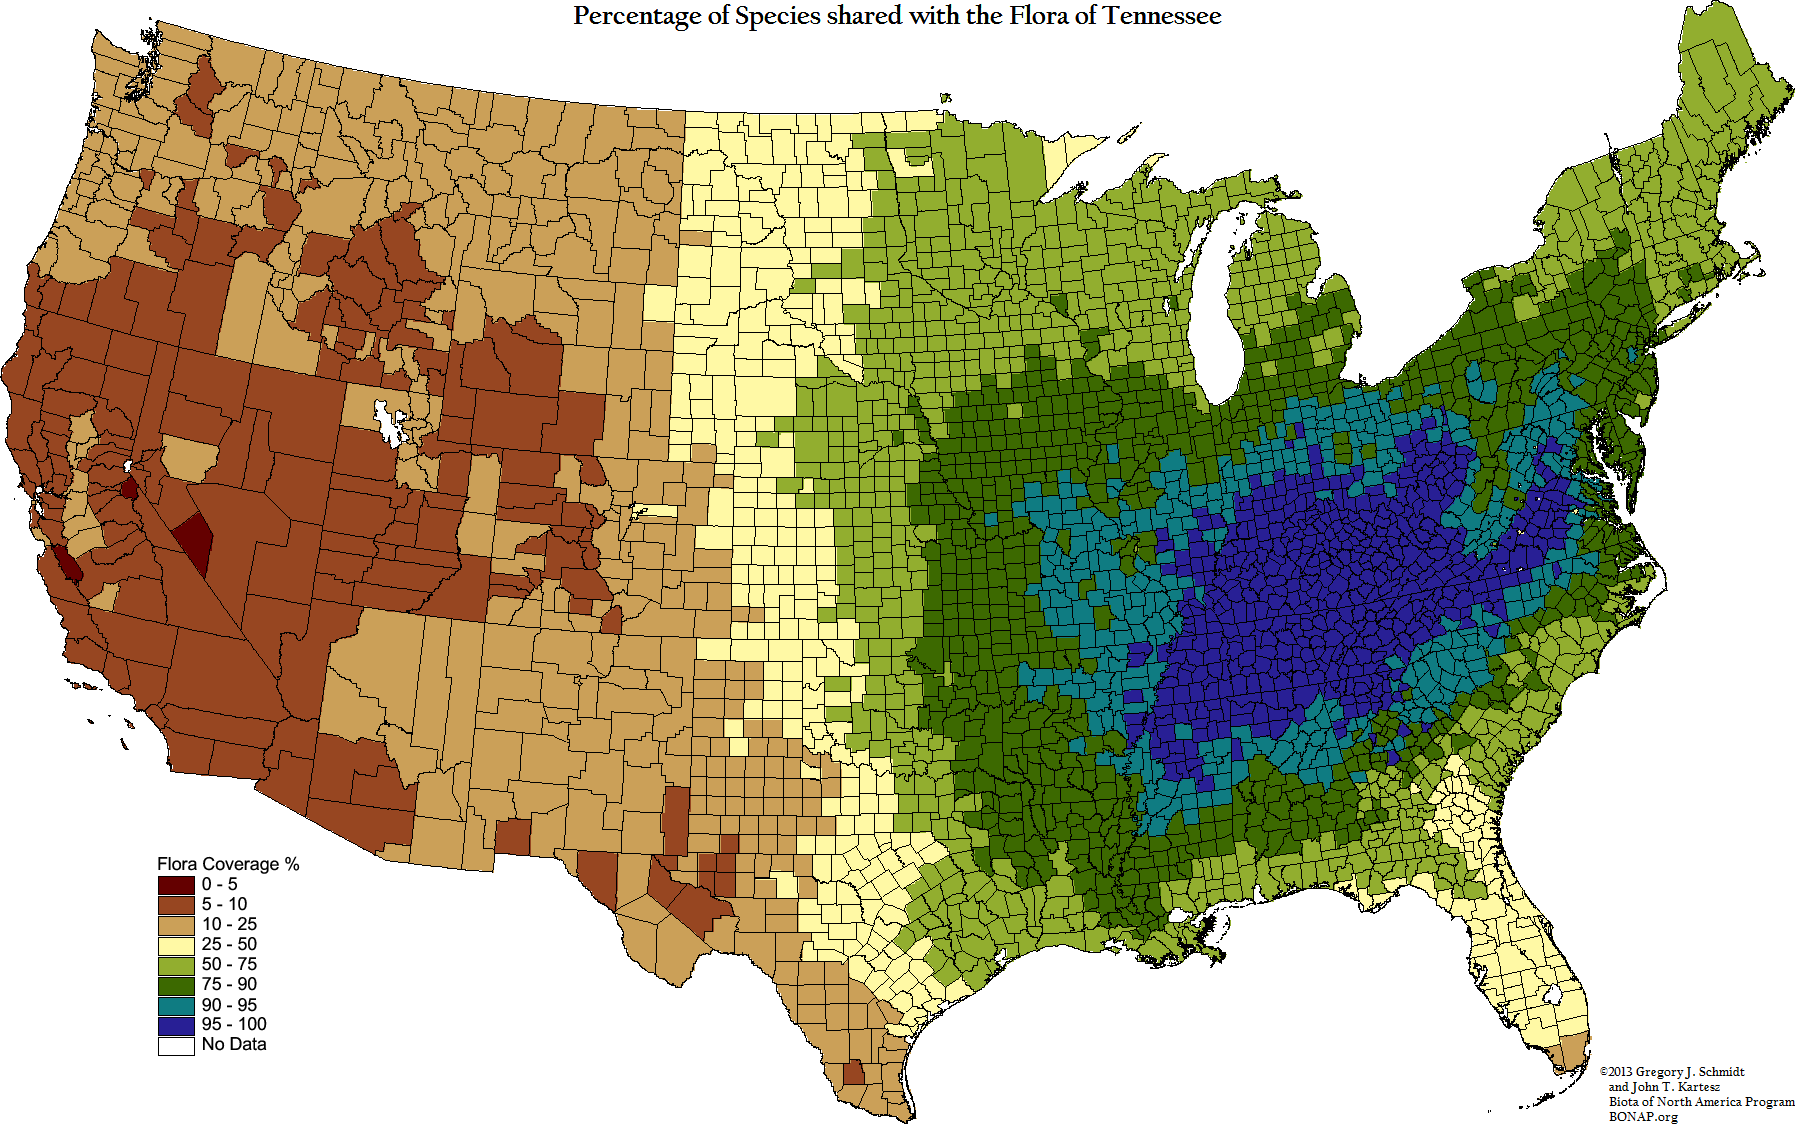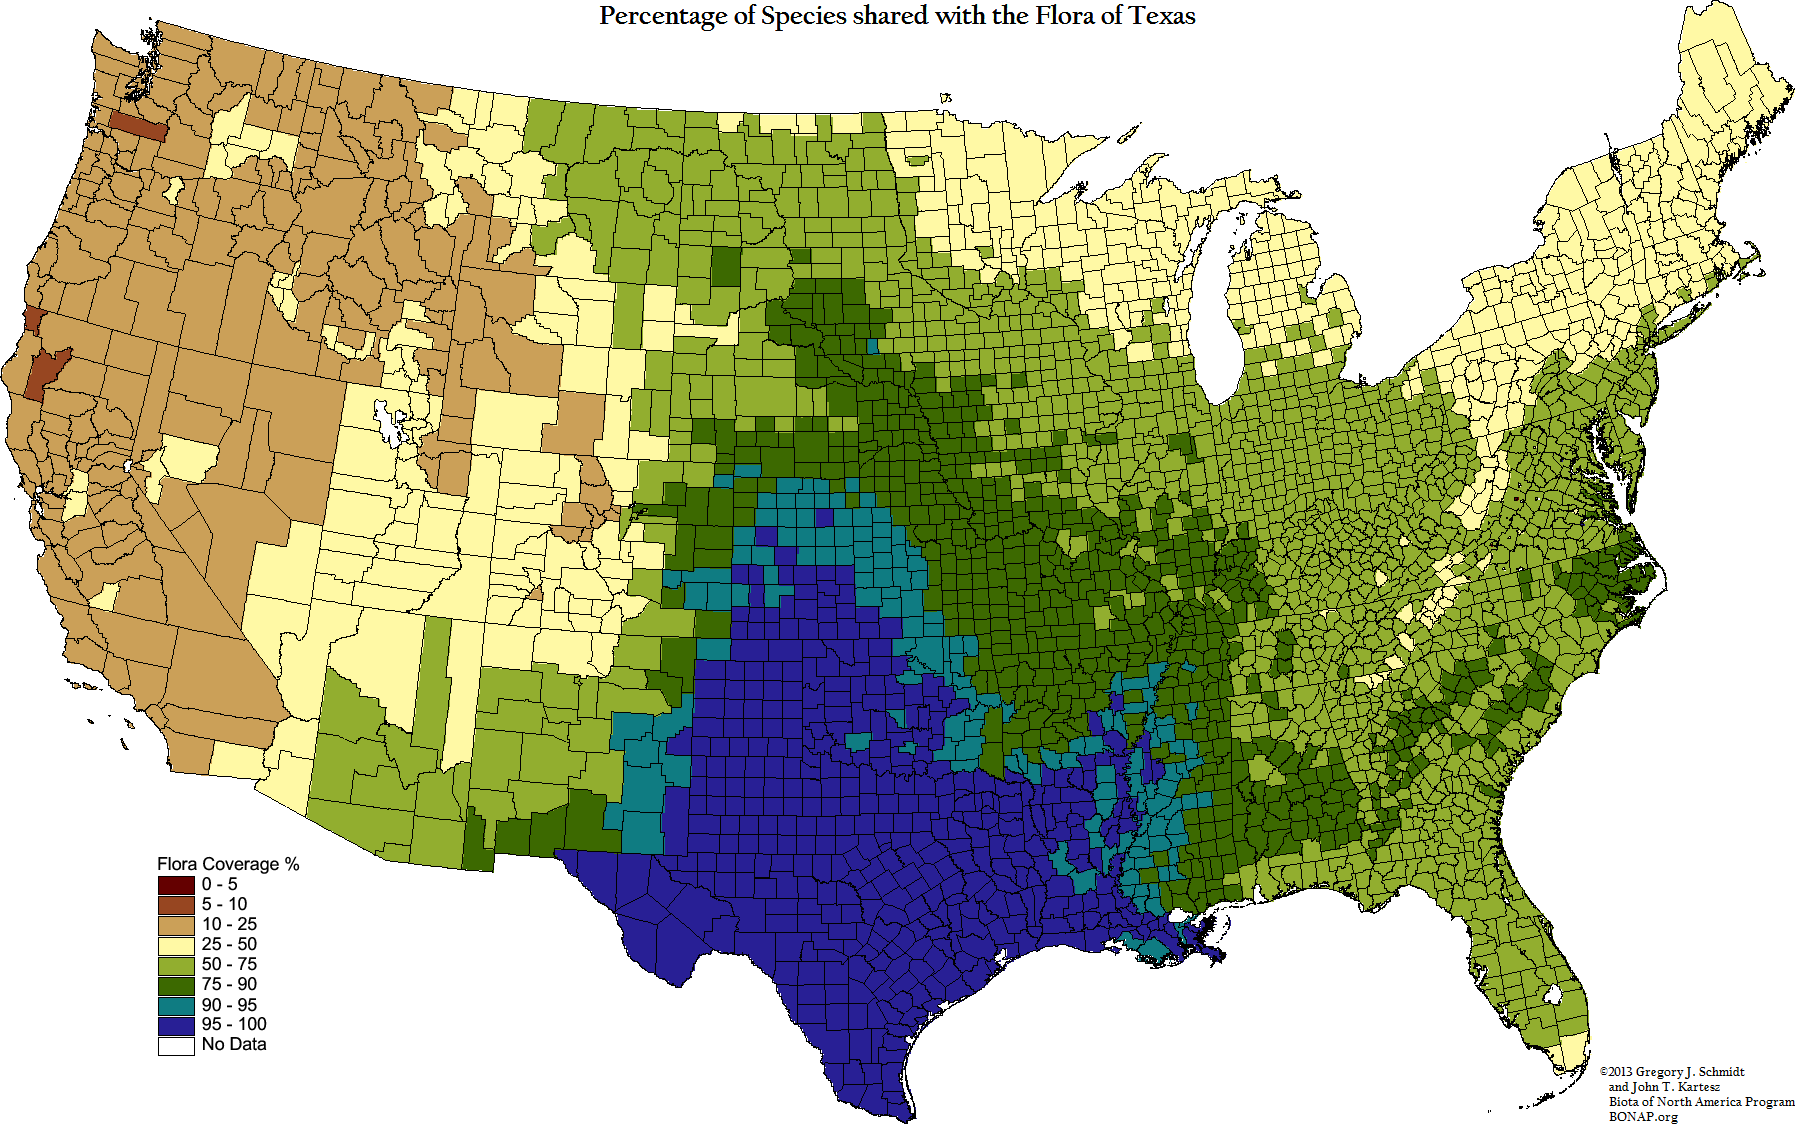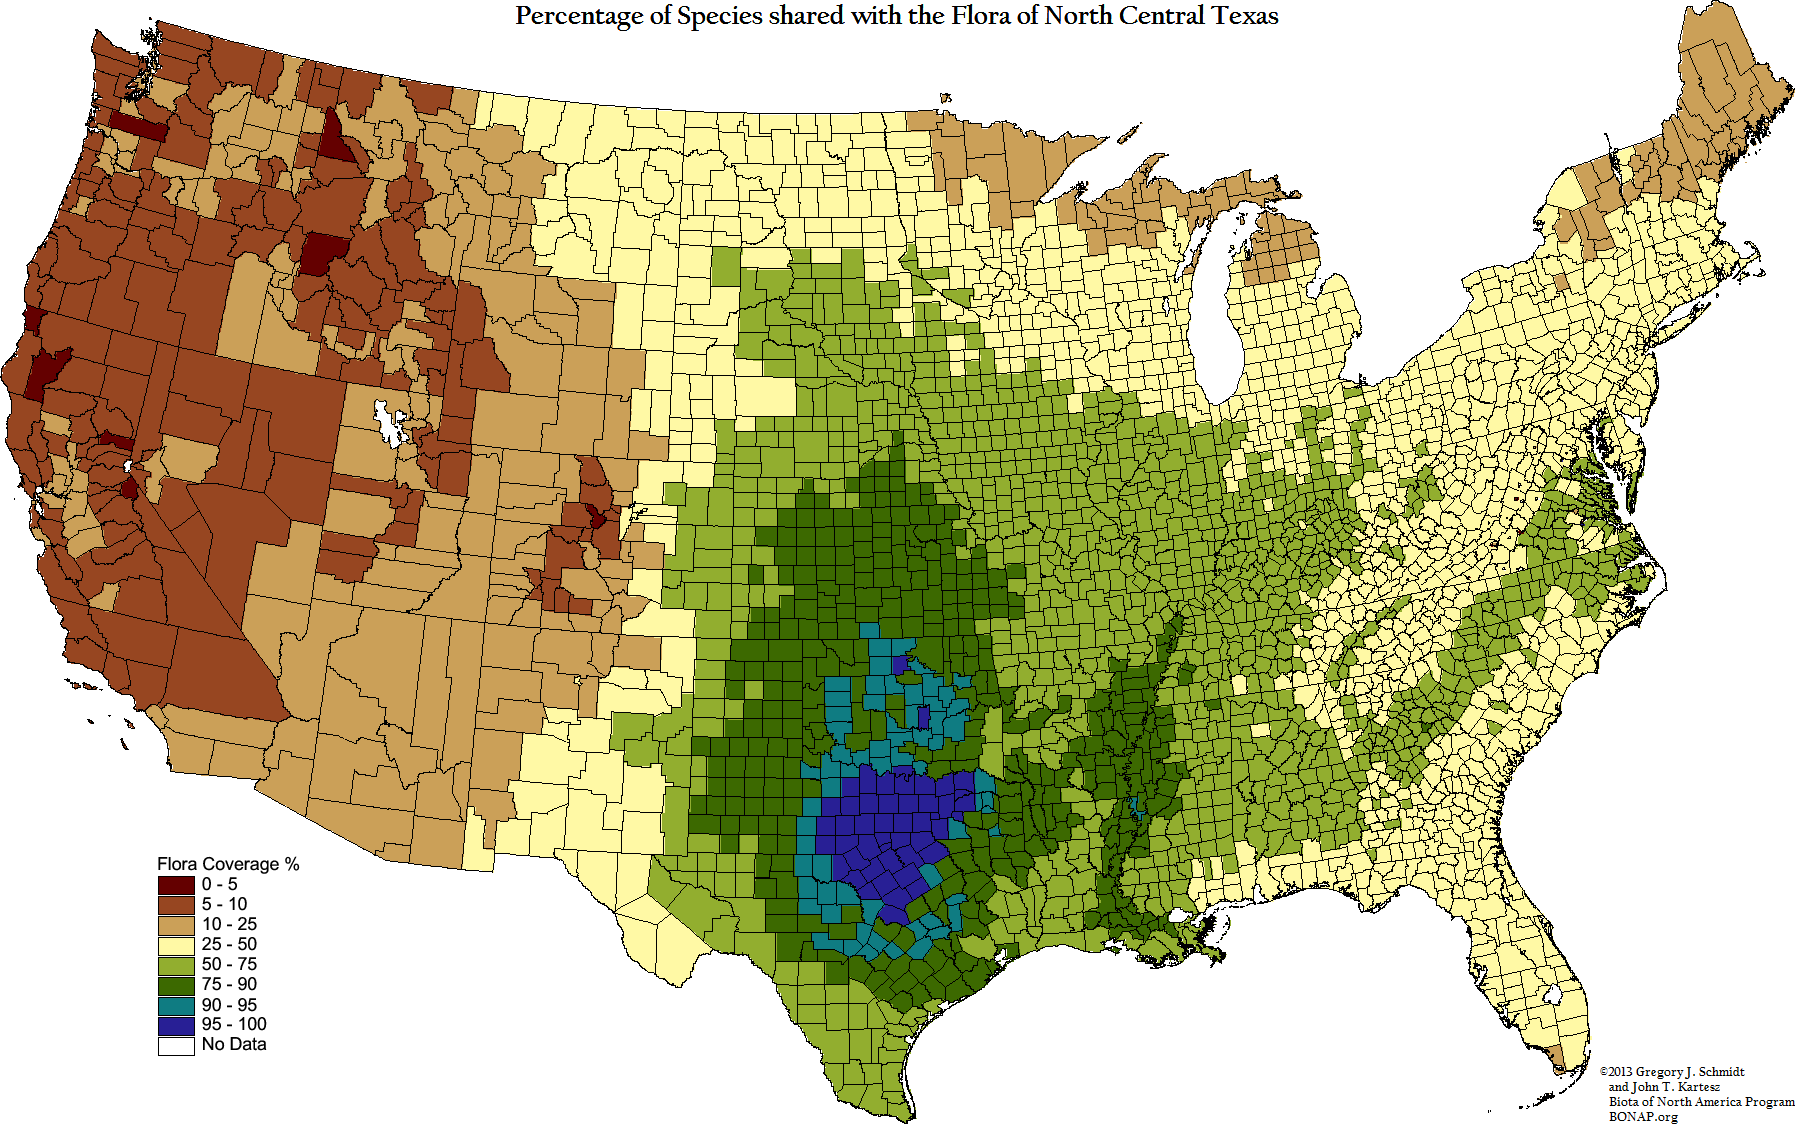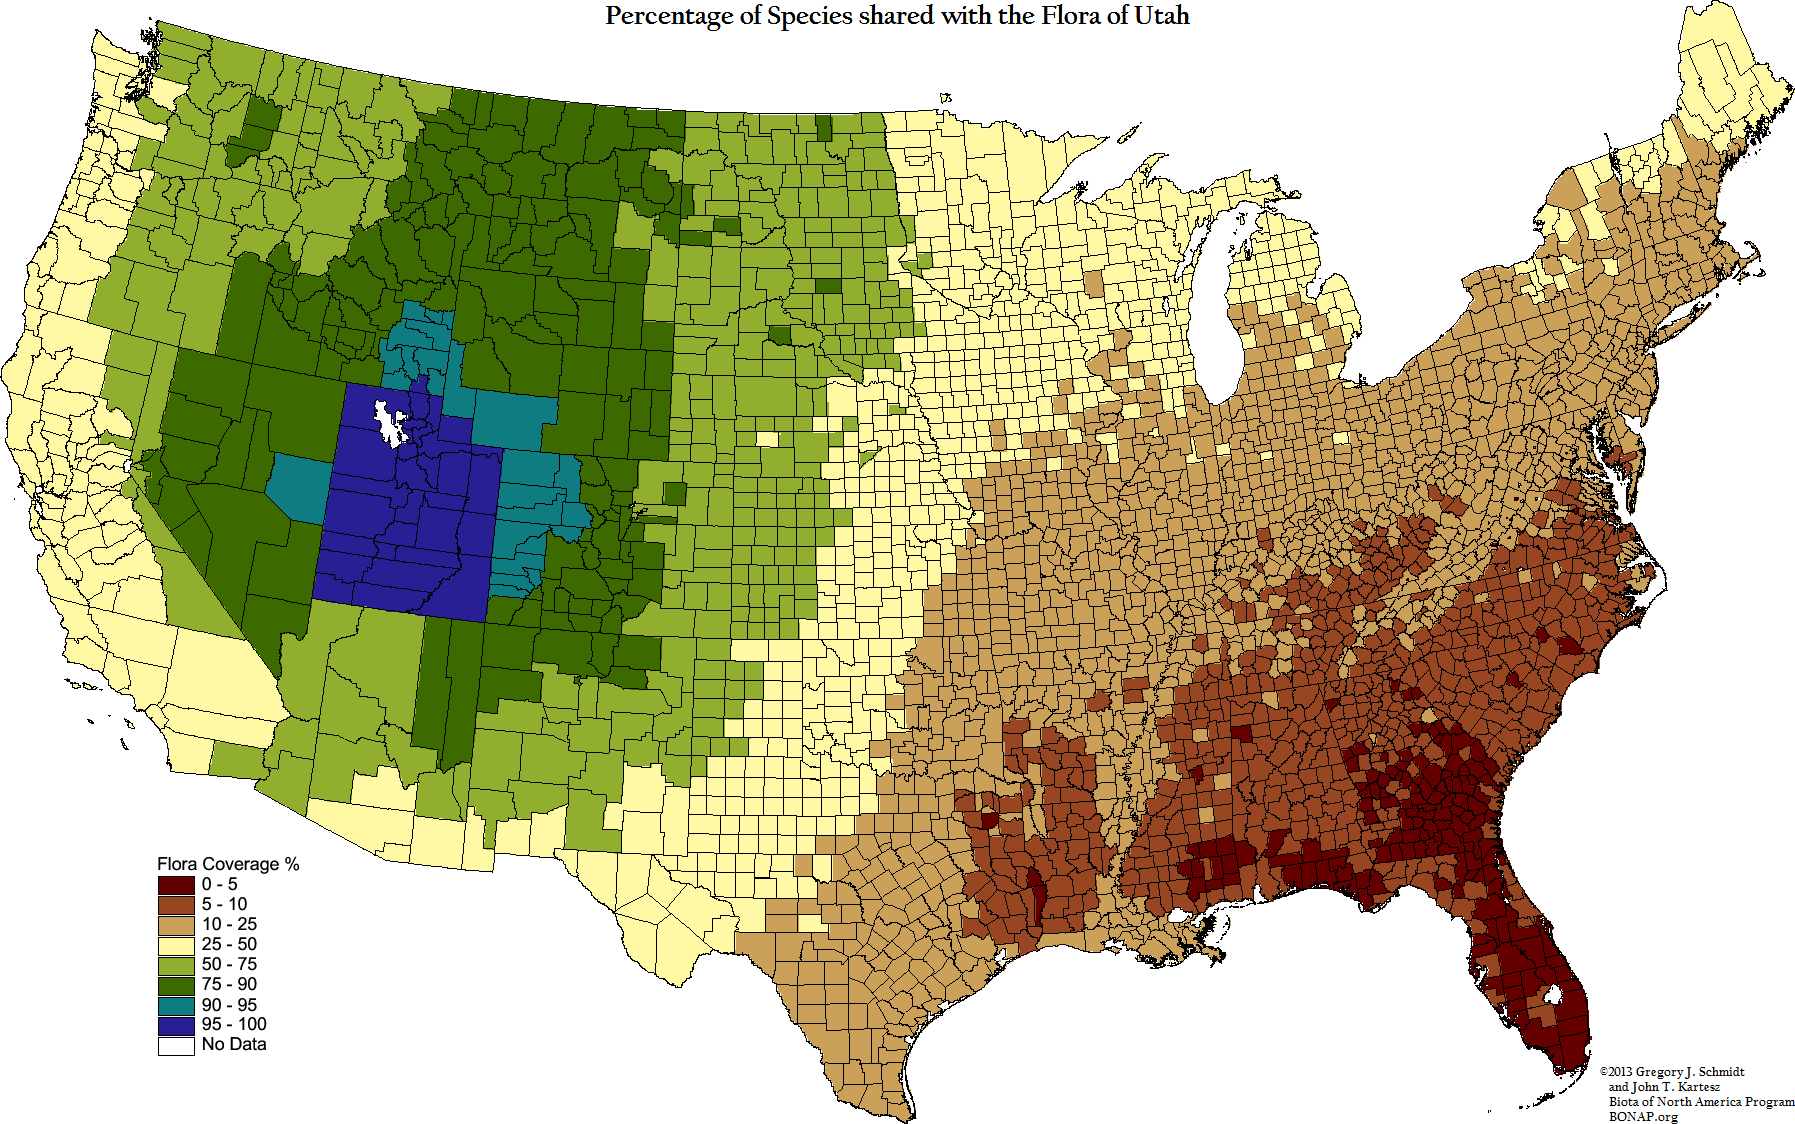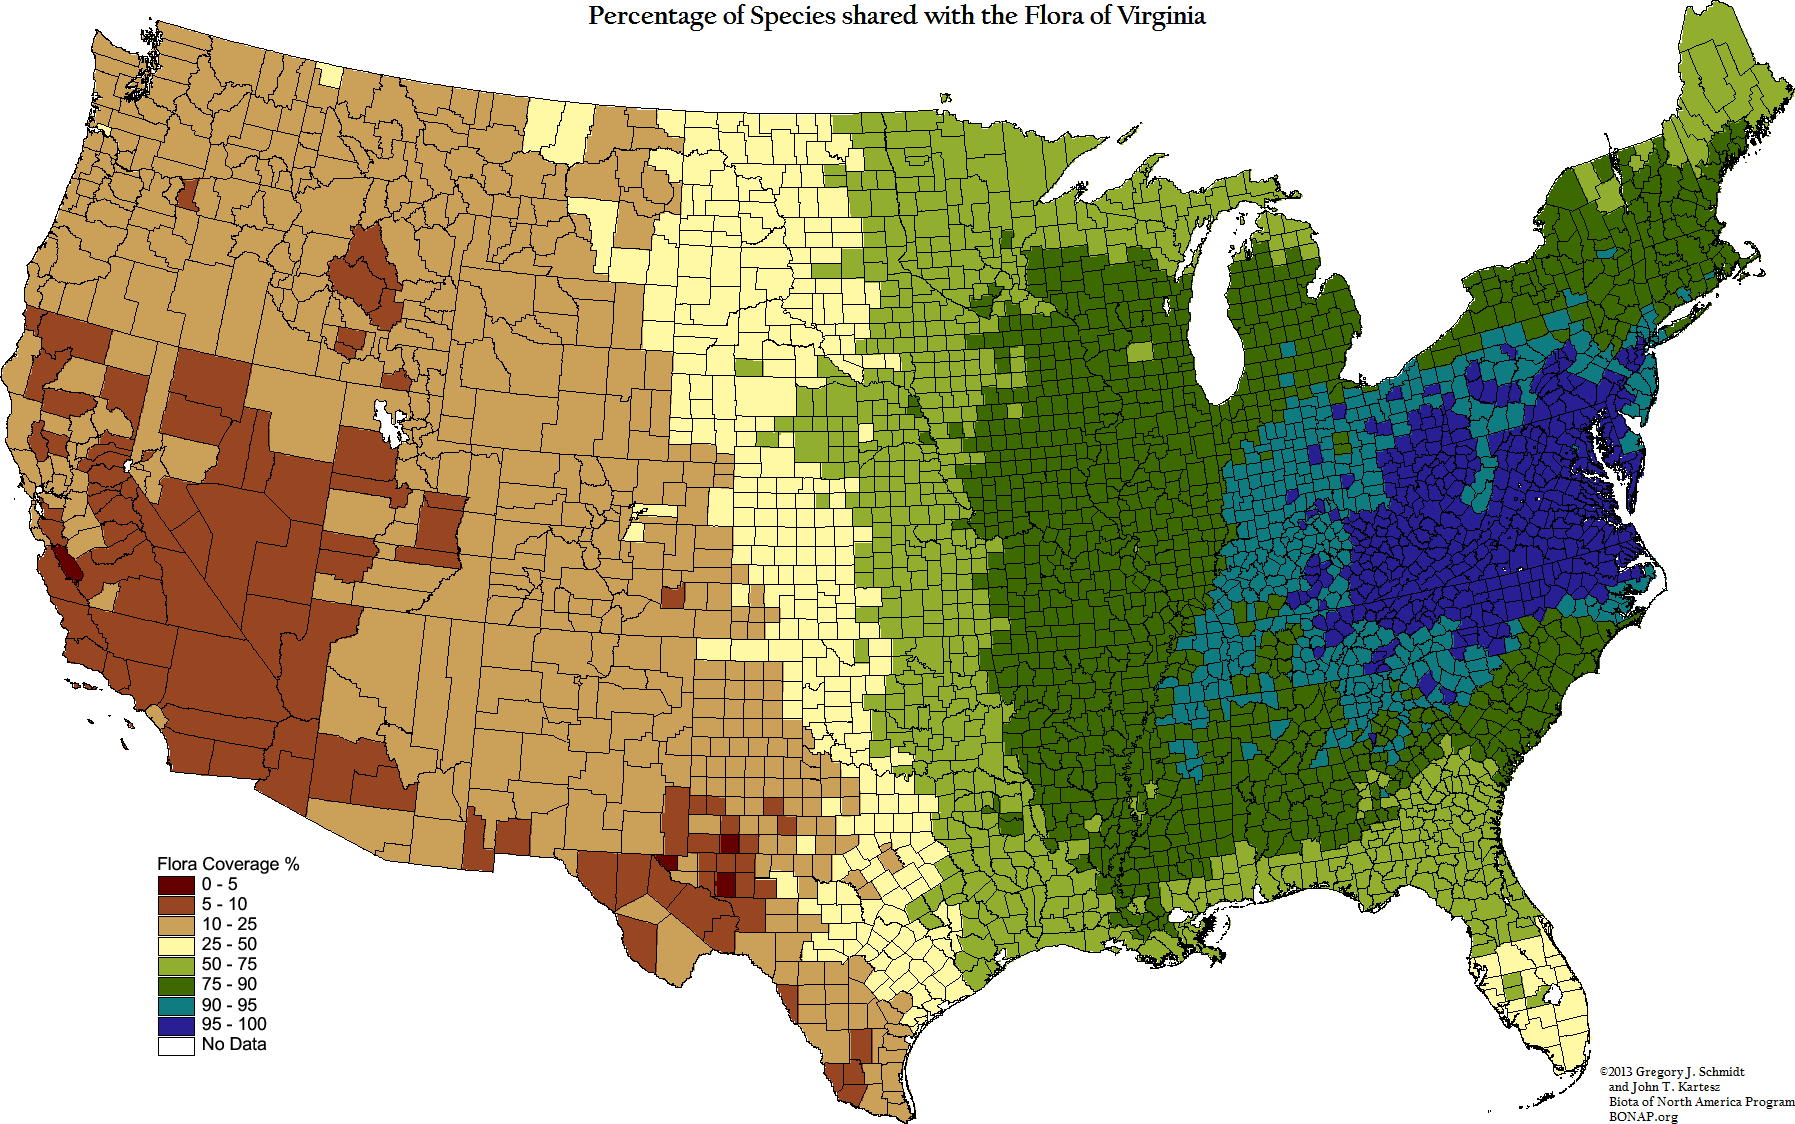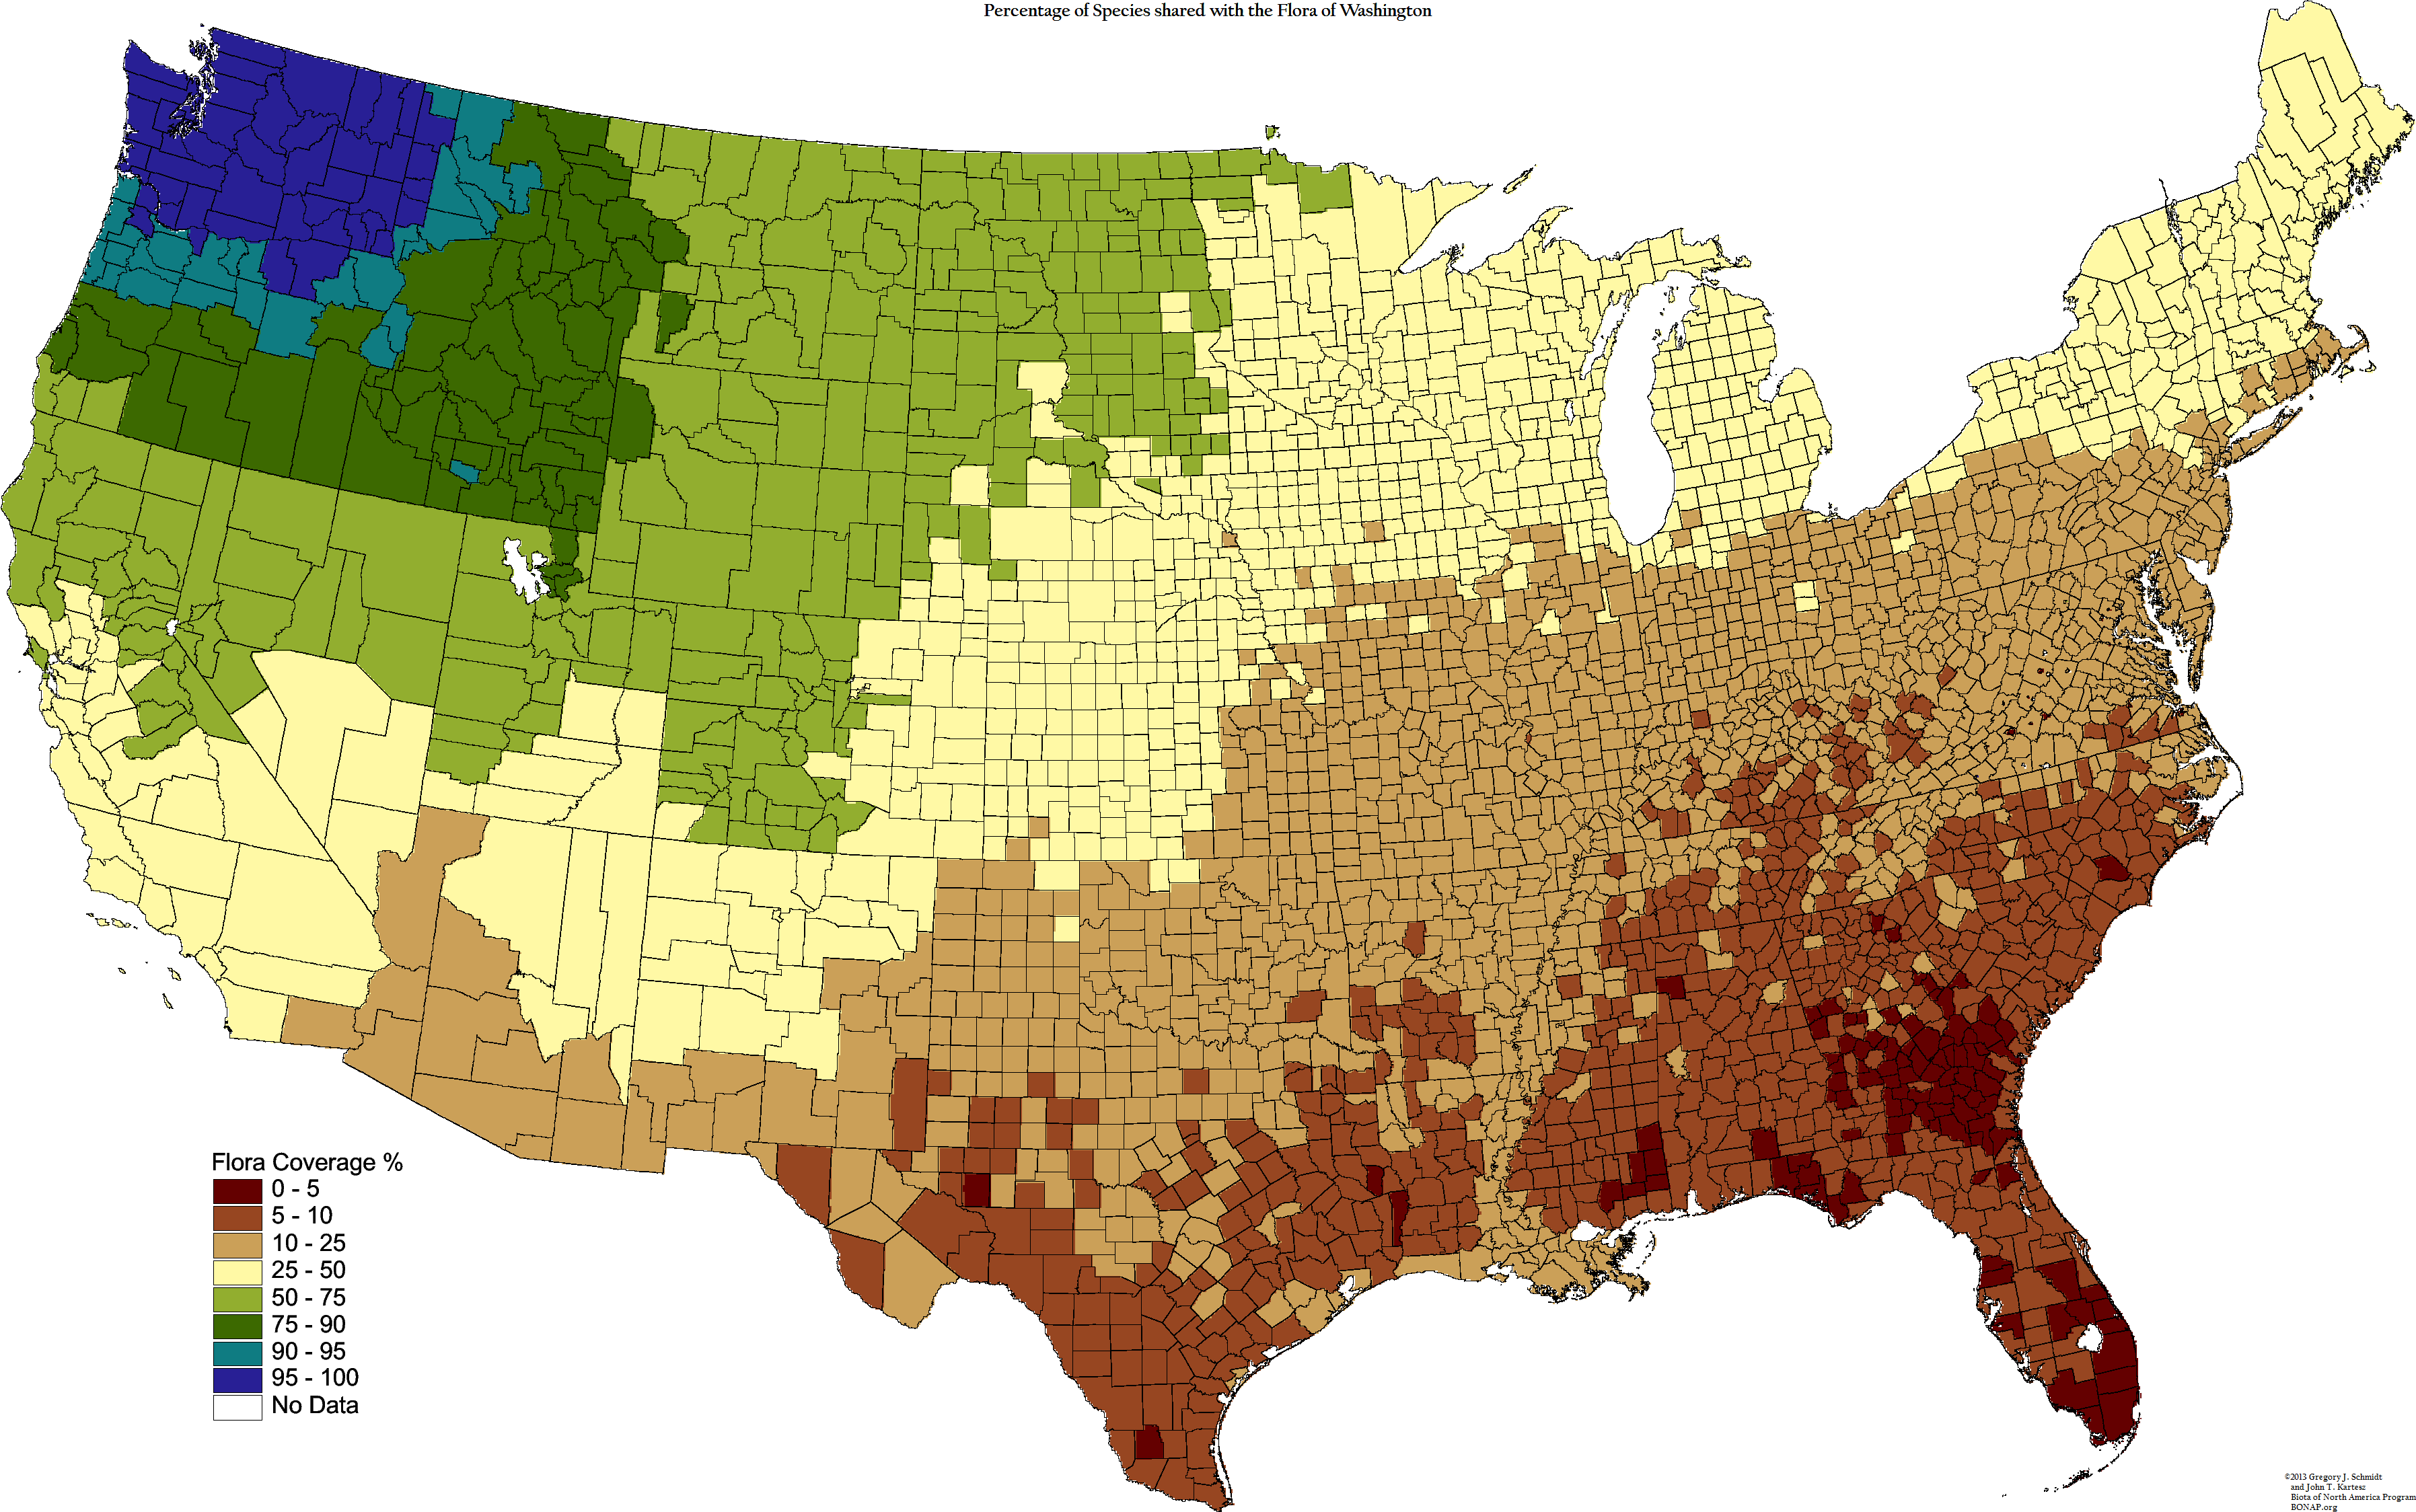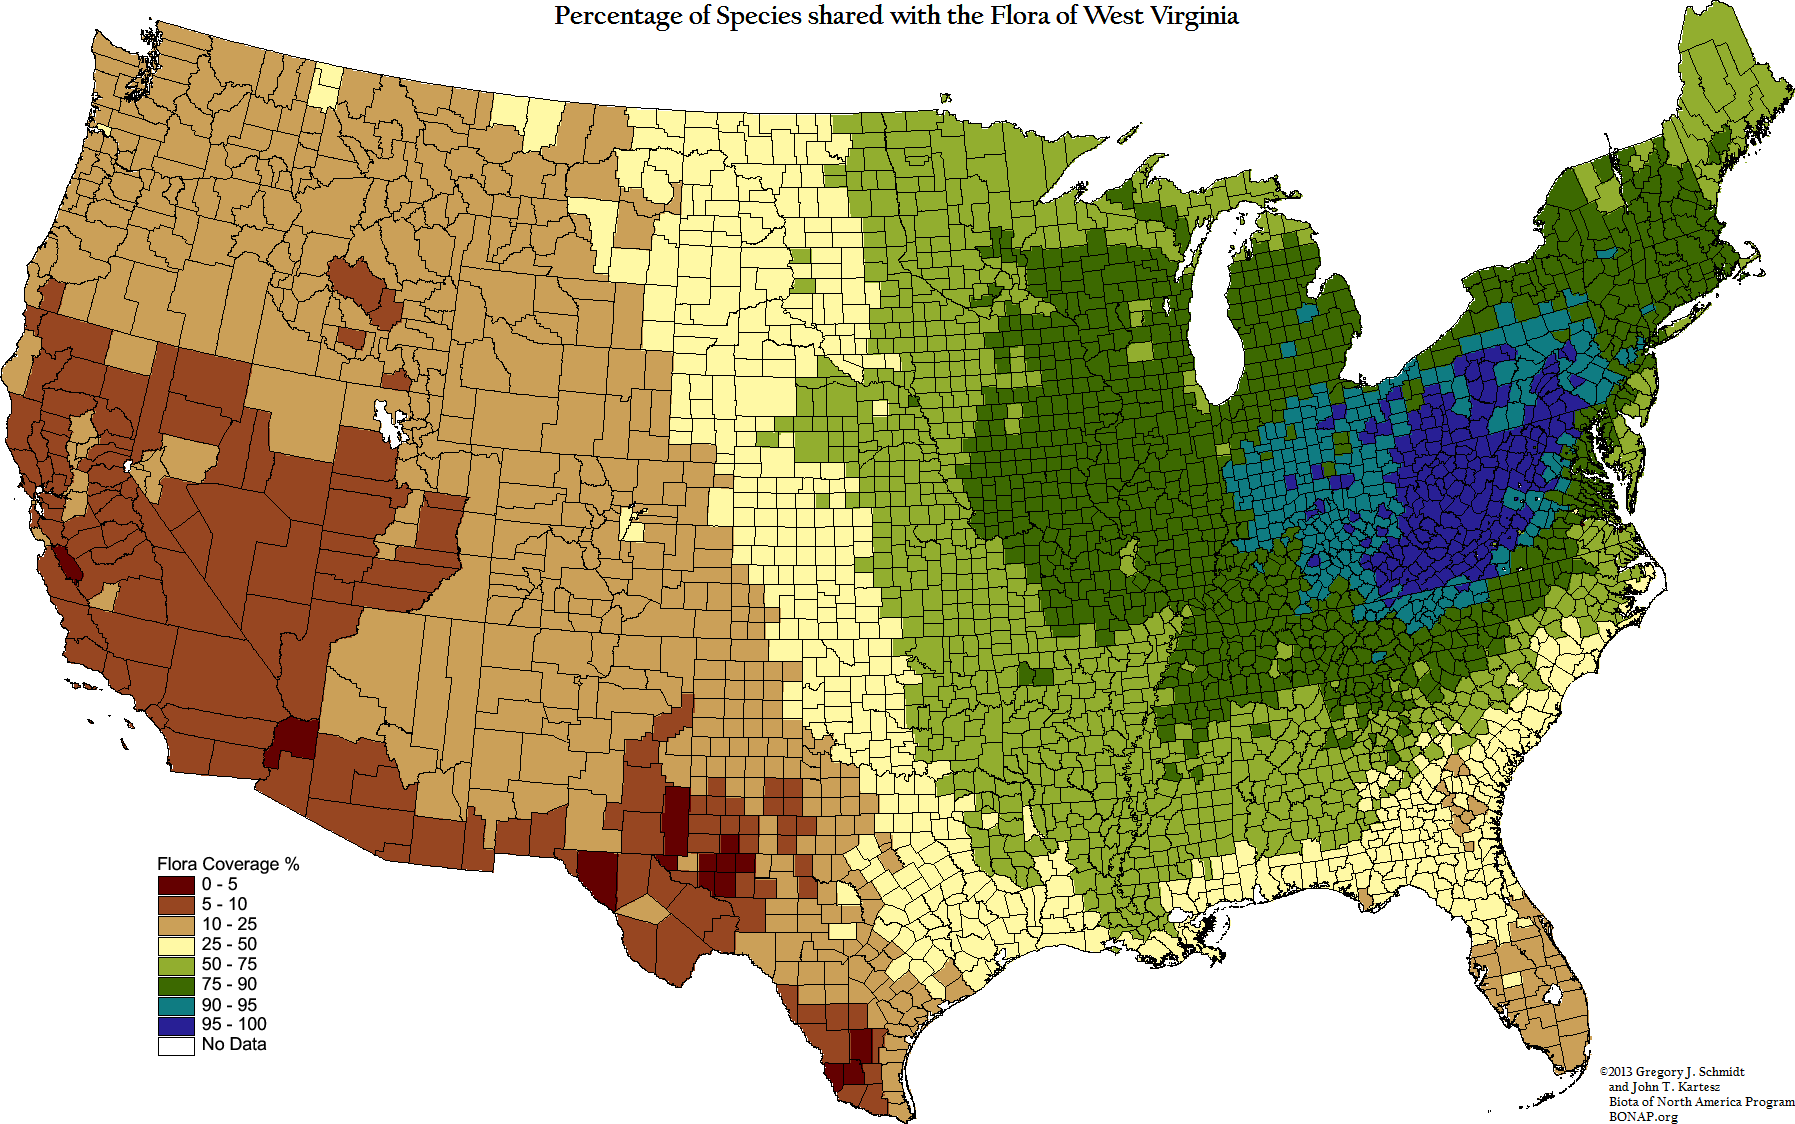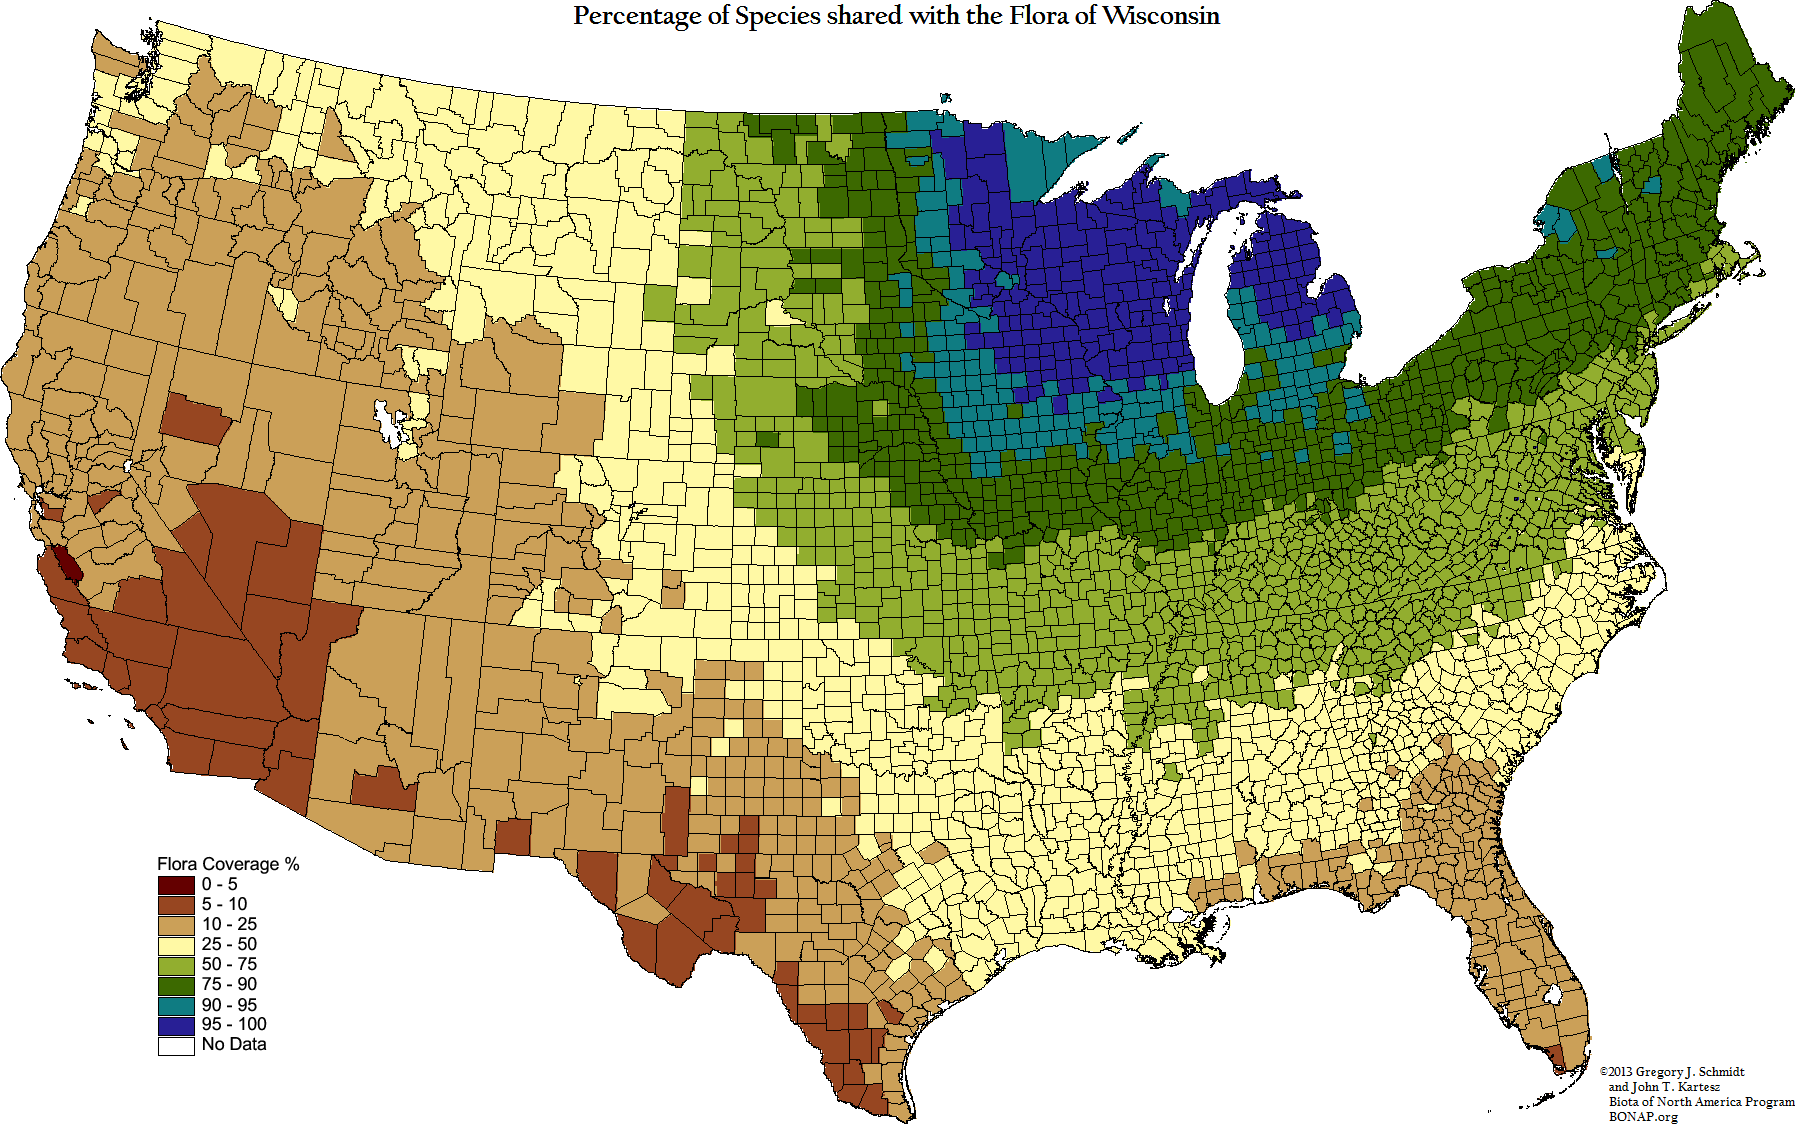
This series of maps shows the relative similarity of the native vascular flora between U.S. counties and selected individual U.S. states and/or
regions. Although not exhaustive, we have selected various states to represent each region or the country, and ones that best reflect
unusual patterns of floristic similarities. For some states, profound similarities (or dissimilarities) become obvious once their floras are
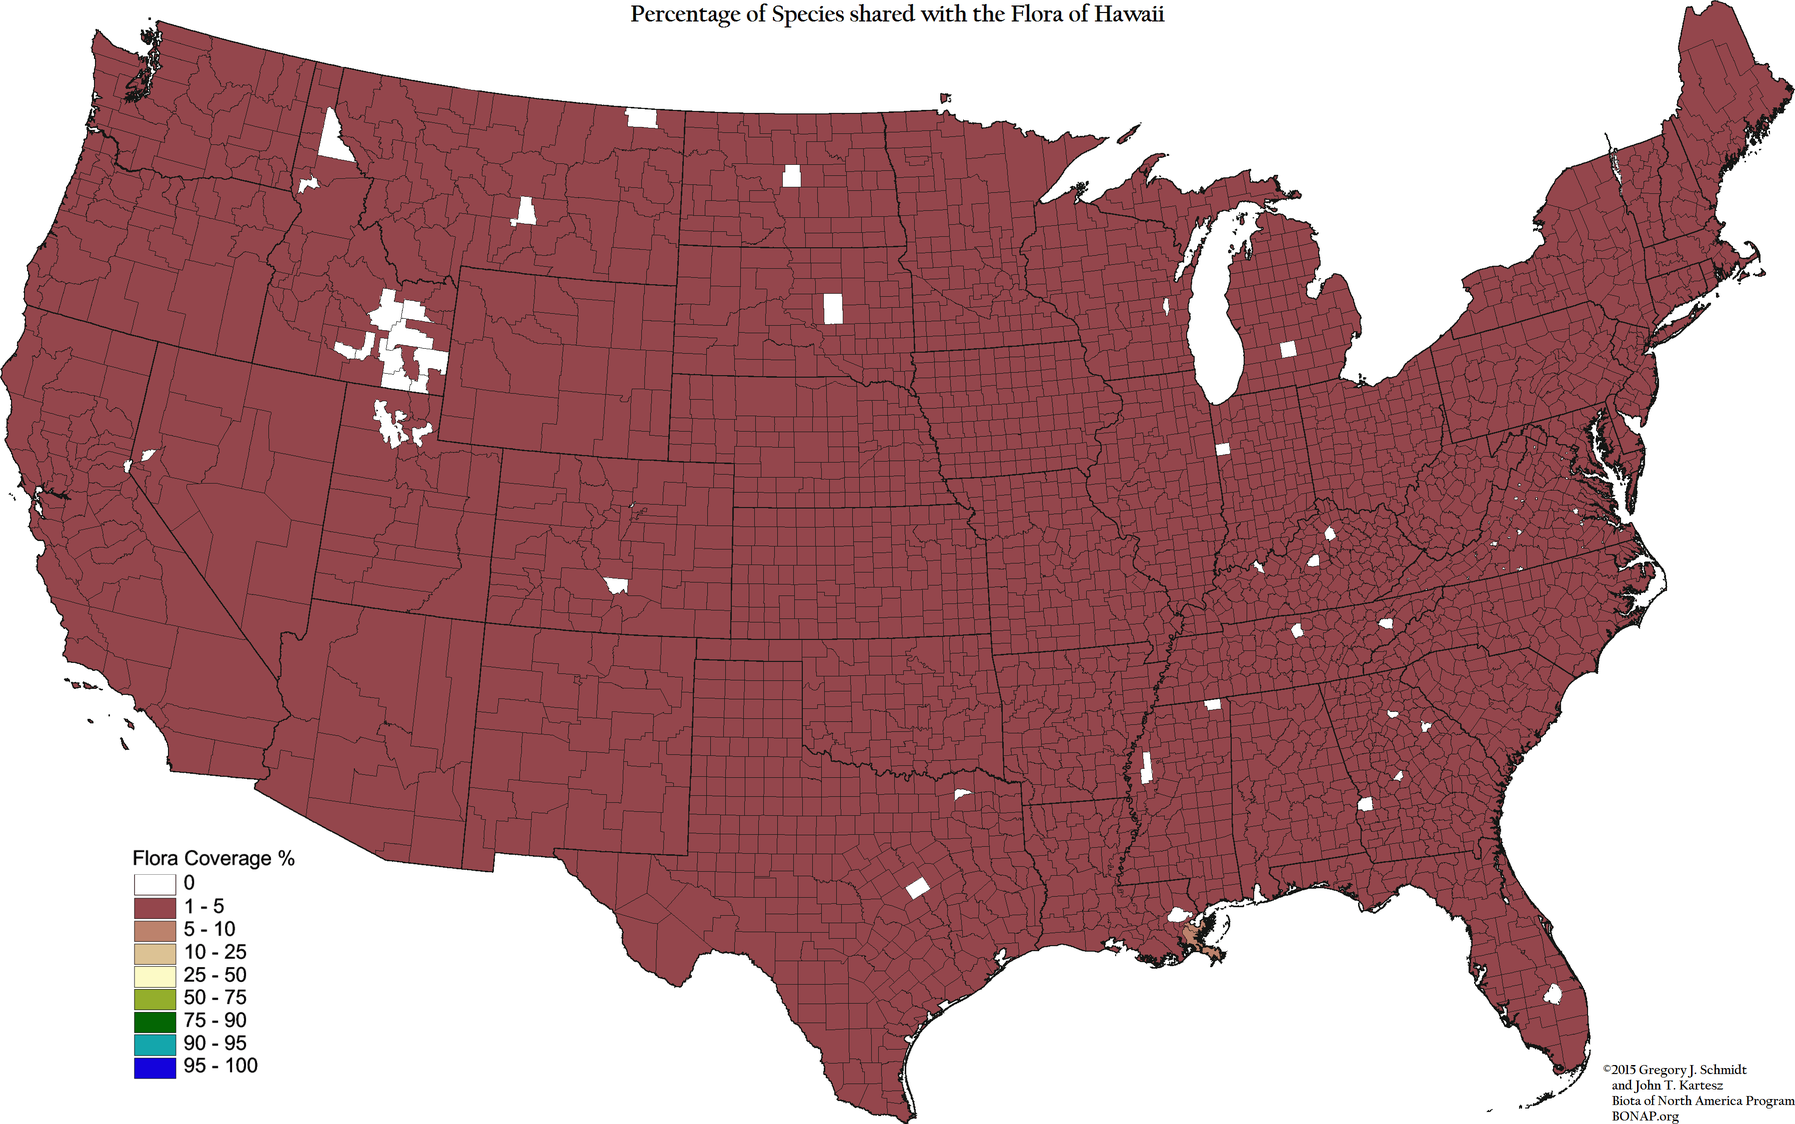
compared. Note, for example, how dissimilar the floras of Alaska and Hawaii (maps #2 and #15) are from the rest of the U.S. For Hawaii,
this is quite predictable, with 85% of its native flora being endemic. However, Alaska’s dissimilarity with other US states is far less
predictable, since less than 3% of its flora is endemic. Although a high percentage of the circumboreal flora of Alaska is shared with other
northern areas in Canada, Greenland, and throughout vast areas of tundra in the arctic and subarctic, only a relatively low percentage of
Alaskan species is shared with the flora of other U.S. states (see the seventeen northernmost tier counties of Washington, Idaho, and
Montana).
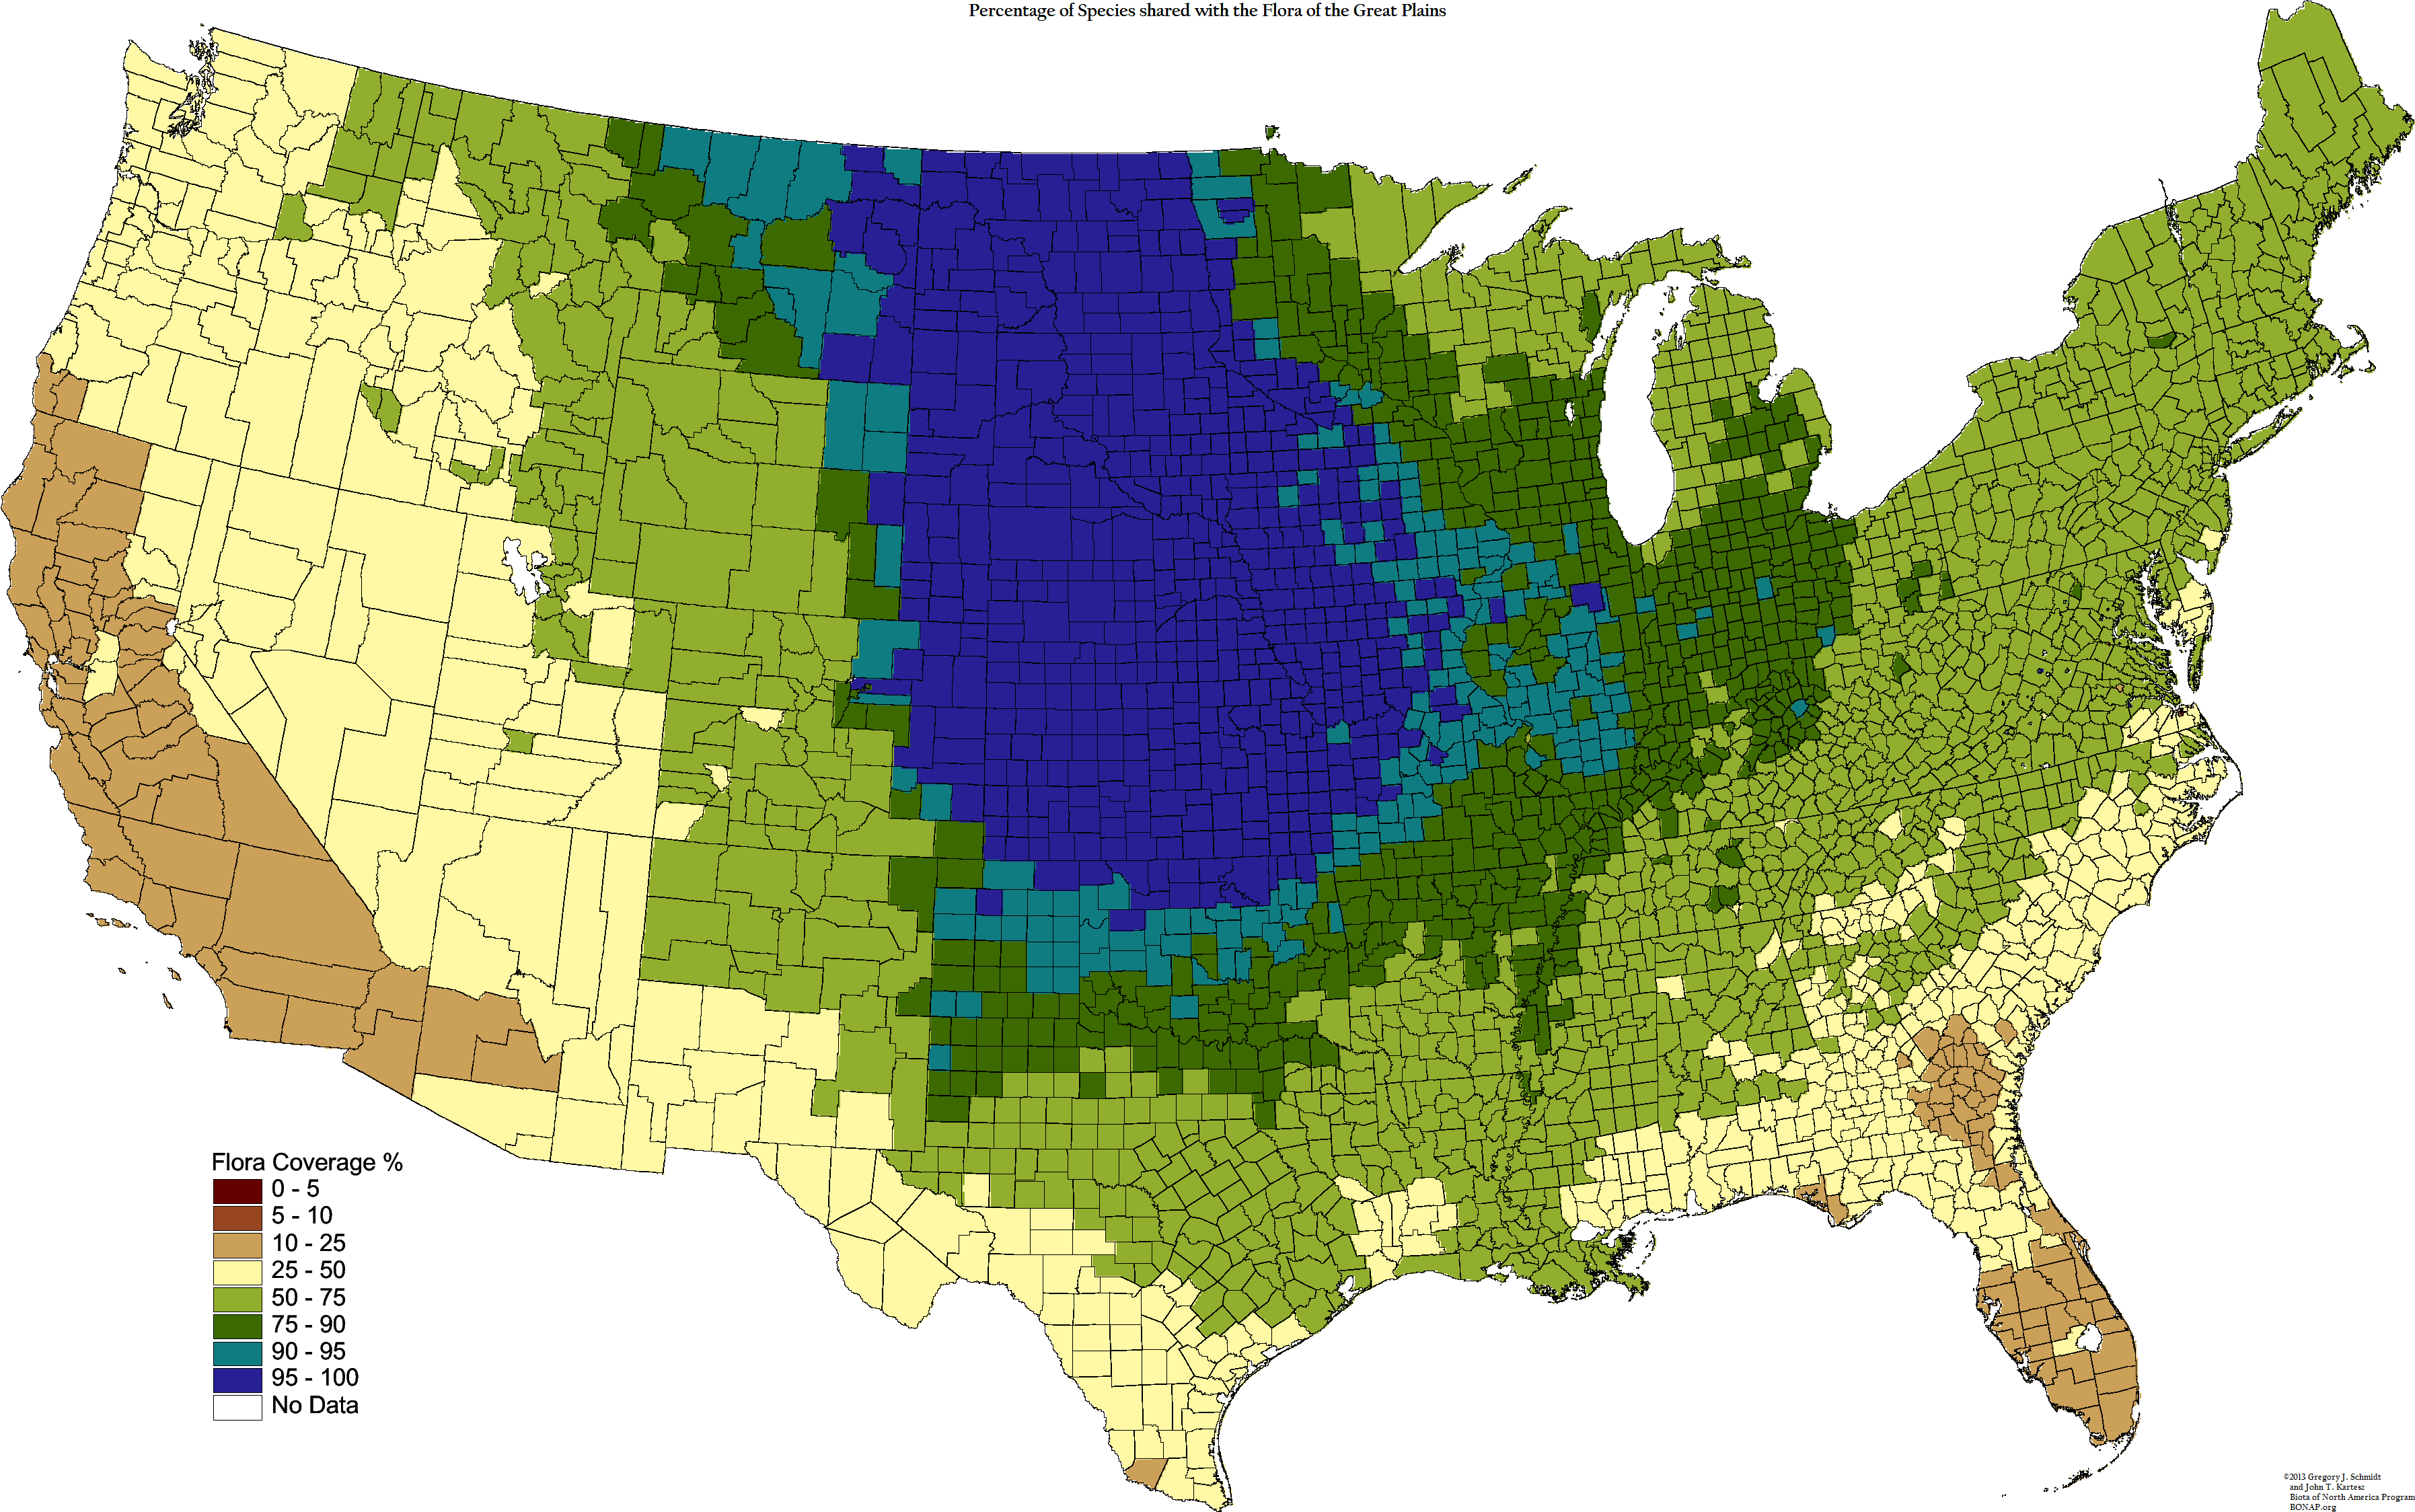
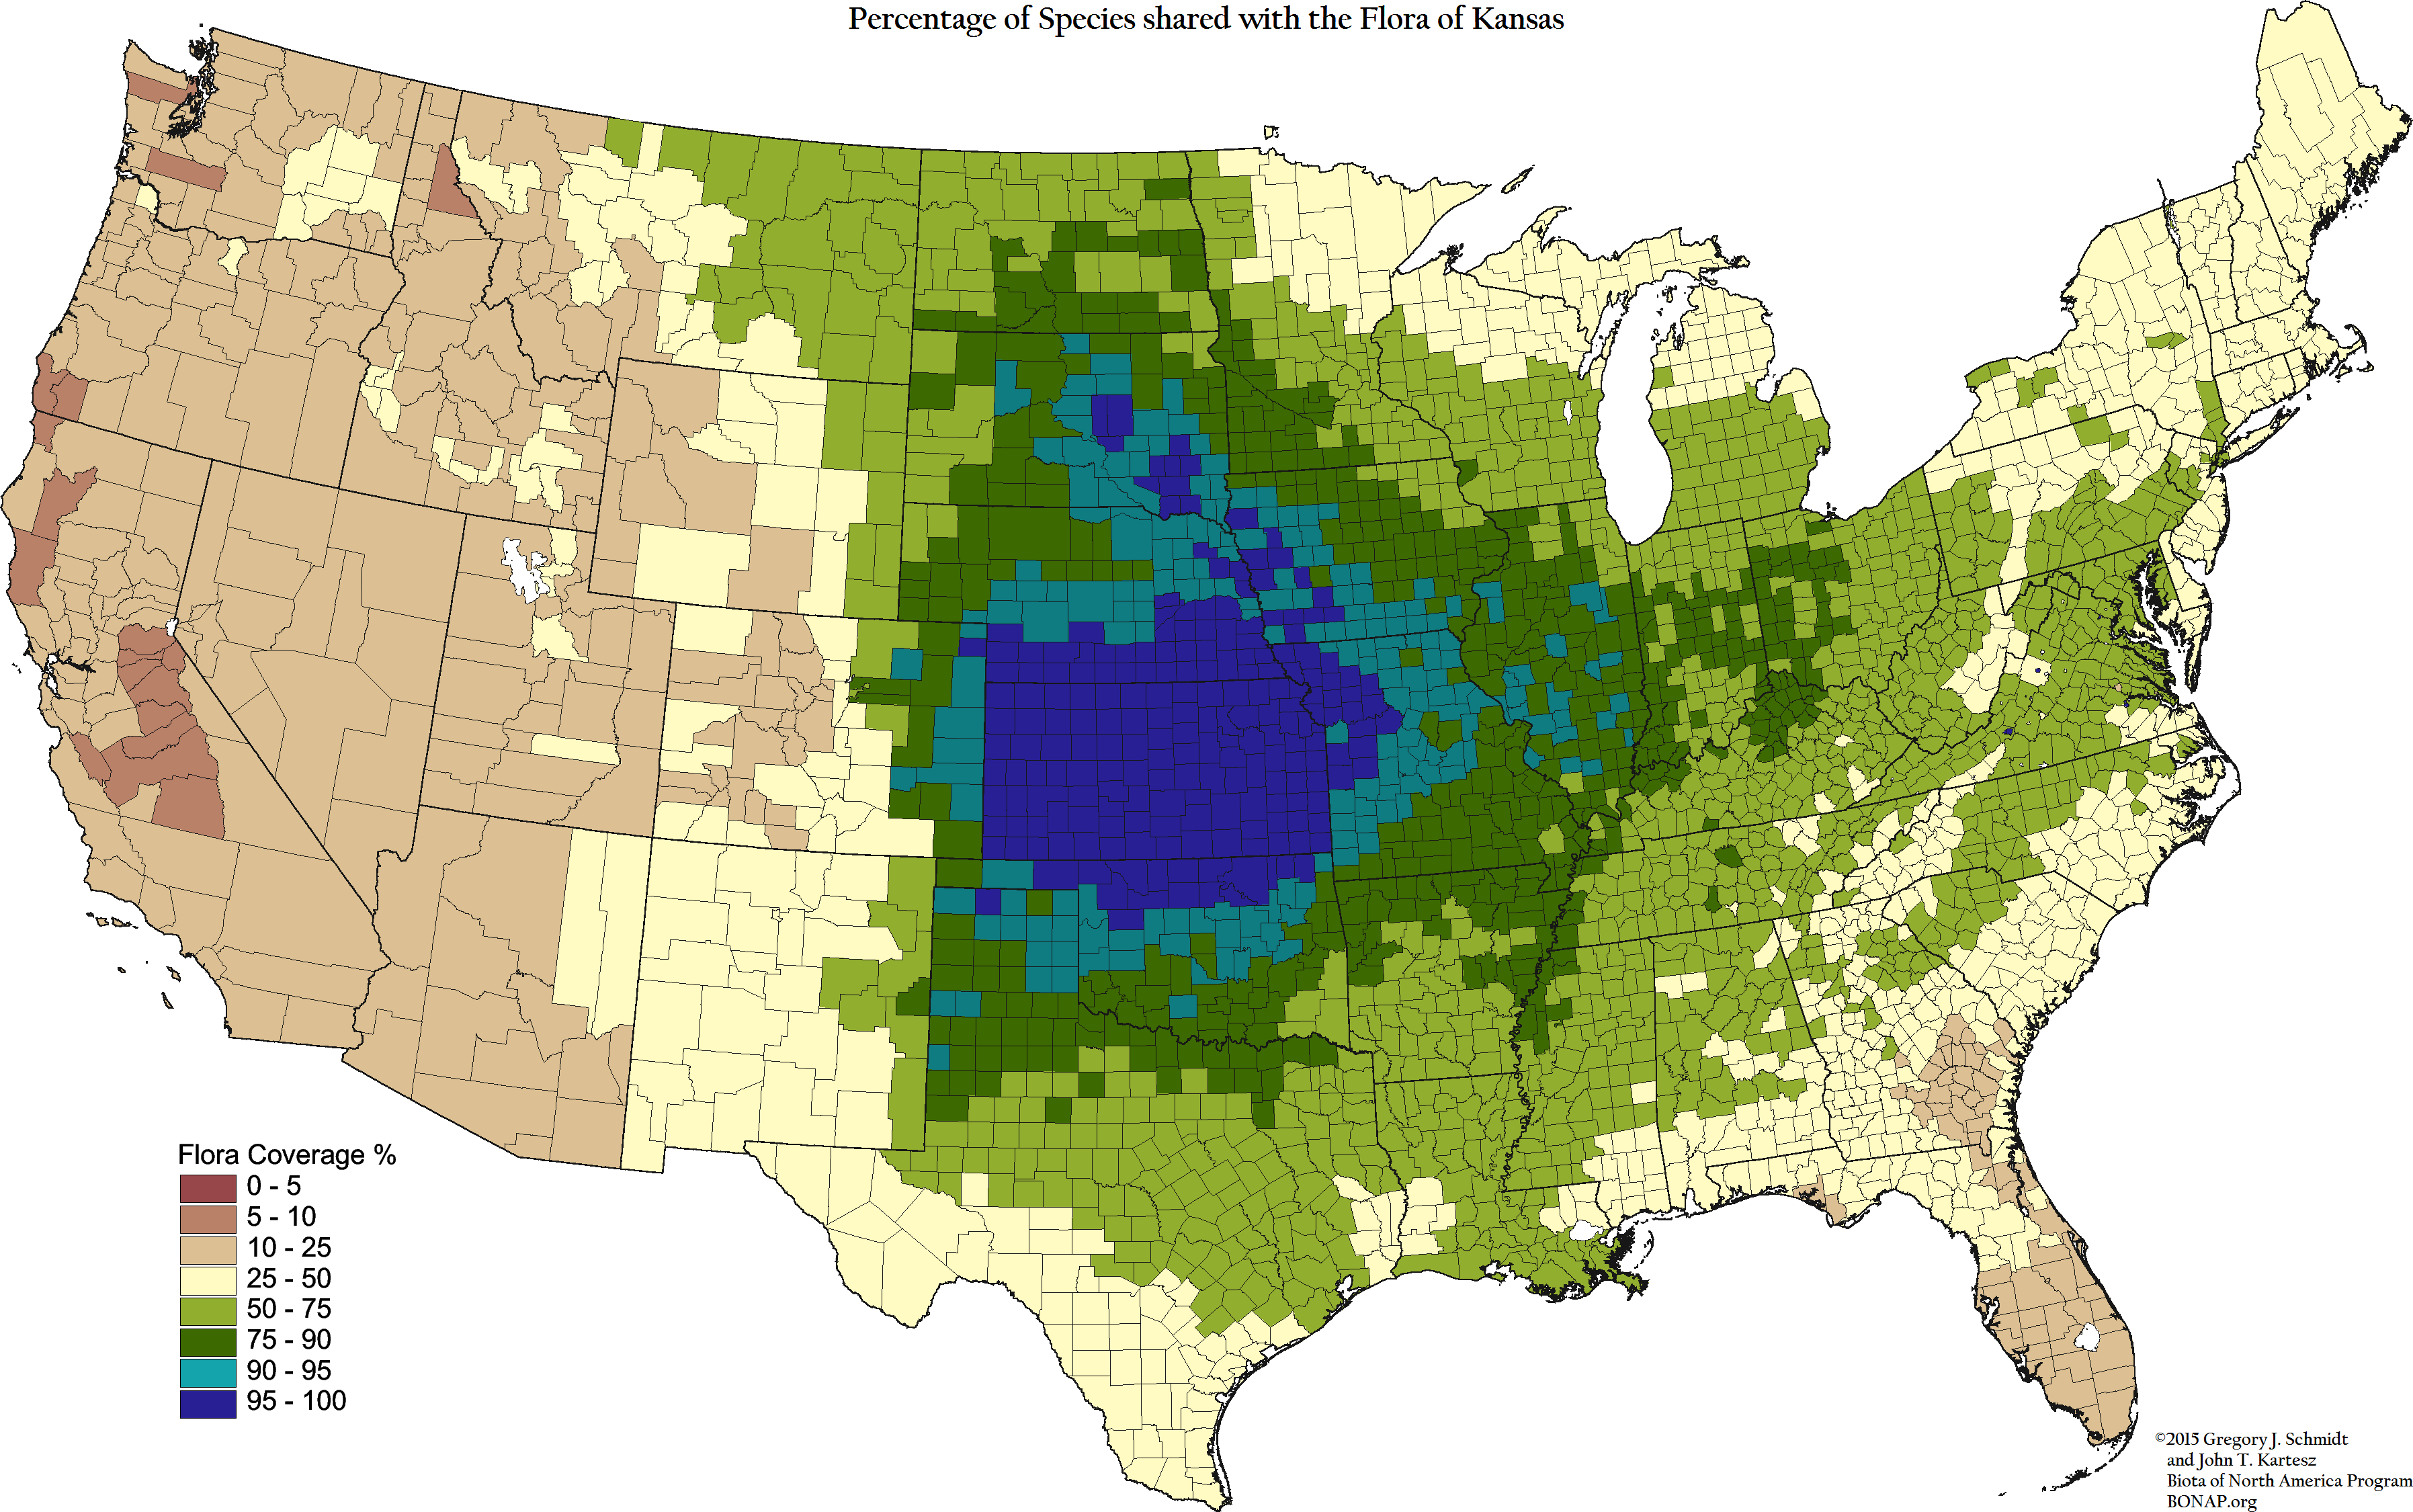
Other patterns of floristic similarities exist between state floras of certain states of the Great Plains (map #13) and the rest of the U.S. flora
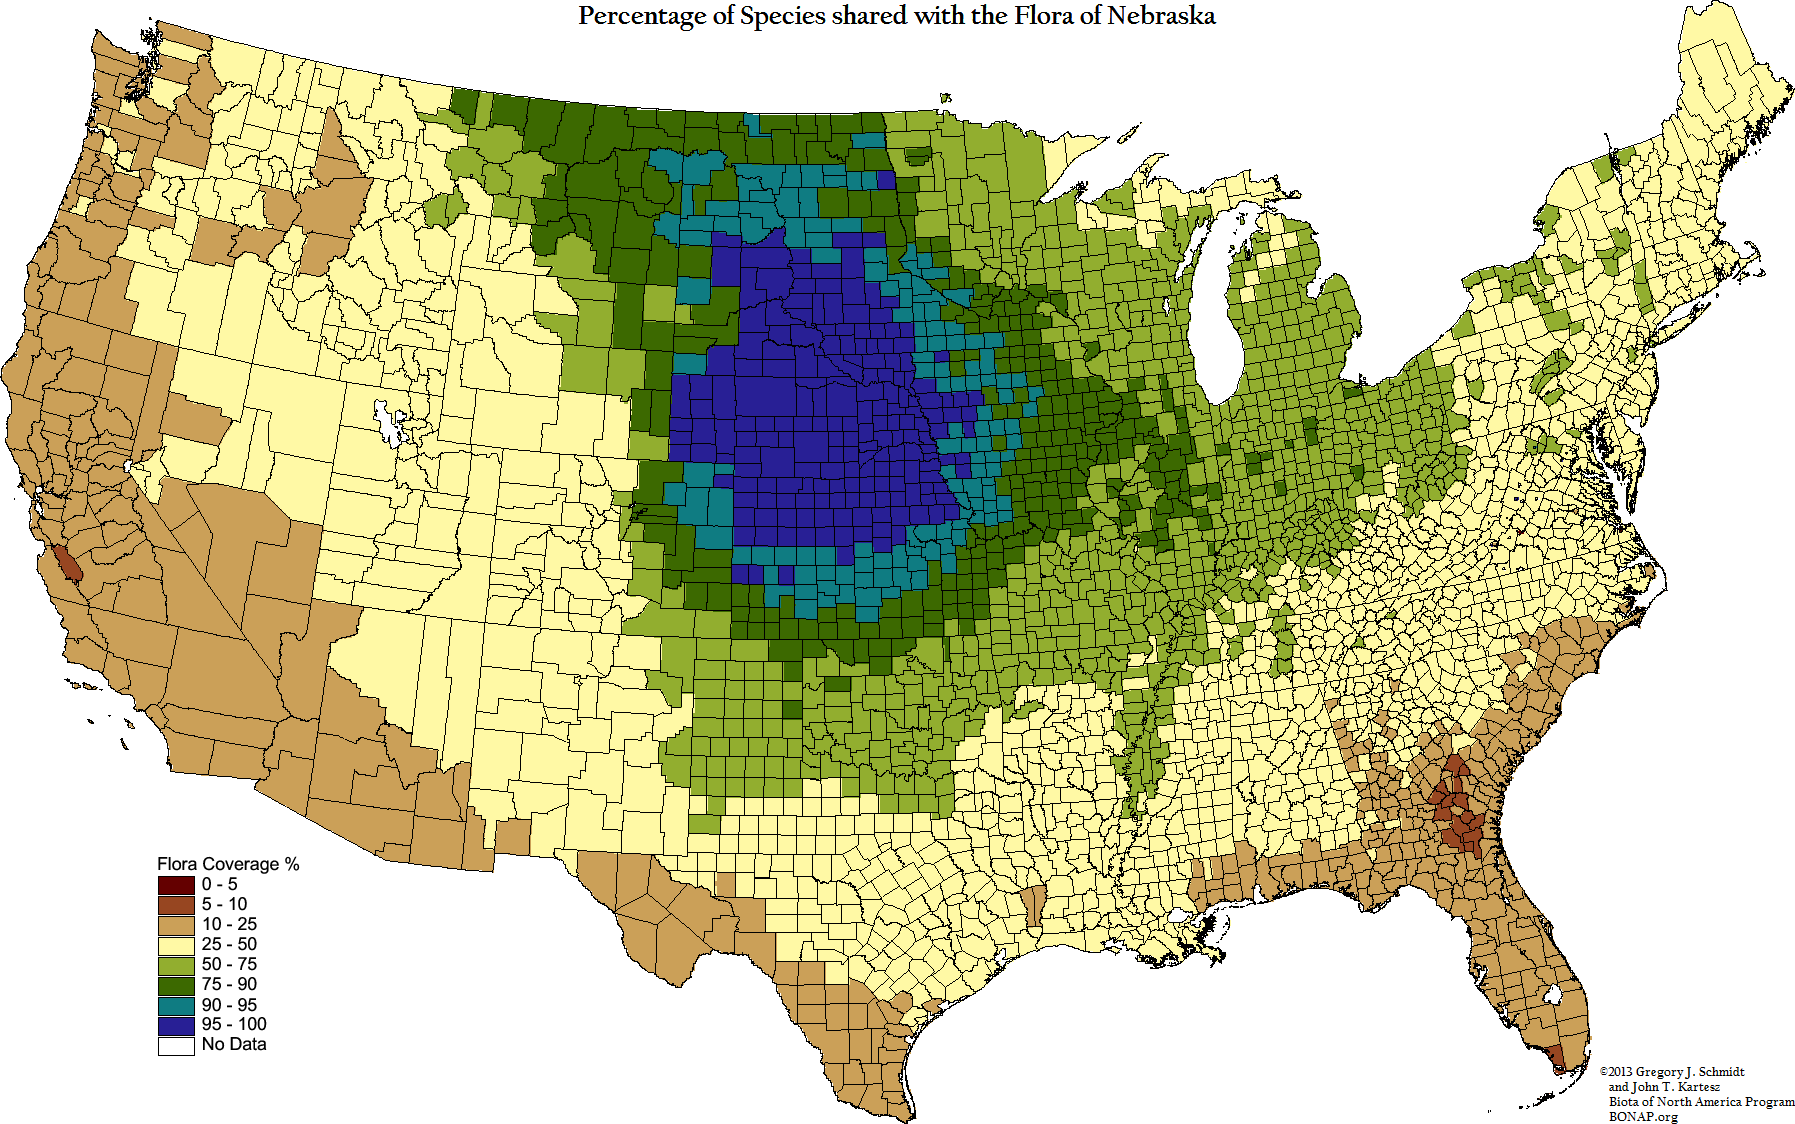
(specifically the states of Nebraska and Kansas [maps #24 and #17]). For its relatively small physical size compared to states like Texas or
California, and relatively low species diversity (1,500 native species), map #24 shows that Nebraska has one of the most ubiquitously similar
floras of any U.S. state or Canadian province. It has zero endemic species, and there is not a single U.S. county that shares less than 6% of
its flora with Nebraska’s. Even more unusual is that only one county in California, and thirteen counties in Georgia shares 5-10% of their
floras with Nebraska’s; all other U.S. counties share 10% or more. Therefore, it can be reasonably stated that species comprising Nebraska’s
flora are the most widely shared of any in North America. One might argue that given Texas’s large flora and geographic location, spanning
both eastern and western floristic regions, it should earn this dubious distinction of having the most shared flora. However, since Texas,
unlike Nebraska, is not centrally located and has such a large native flora (compared with that of most other U.S. states), many being
endemic or near endemic, it is disqualified from consideration.
It may surprise some to see the great floristic similarity that exists between the floras of Tennessee and Virginia, (maps #34 and #38),
regarding their shared similarities with the floras of the Great Plains and Texas.
It has long been known that physical, geographic barriers such as mountain ranges, hot and cold deserts, dry plains, and even great rivers
can play significant roles in restricting or limiting the migration or emigration of plants into new areas. In certain cases, the advancement of
entire regional floras can be stultified or halted by such barriers. The effects of these barriers can be seen via the reduction of floristic
similarities between state and regional floras across the North American landscape. For example, notice how floristic similarities of the
floras of the Northeastern U.S. (map # 28) and Great Plains (map #13) drop, once confronted by the Rocky Mountains and its flora. Notice
too how the dryness of the Great Plains serves as a barrier, thus reducing floristic similarities between its flora and state floras eastward
and westward of it. Also notice how the Great Plains serves as a more effective barrier to the floras of the Southeast U.S. and to the Blue
Ridge, (maps # 33 and #5) than it does to the flora of the Northeastern U.S. Thus, west of the Great Plains, there is a greater sharing of
species with the Northeastern flora than there is with the floras of Southeast or Blue Ridge.
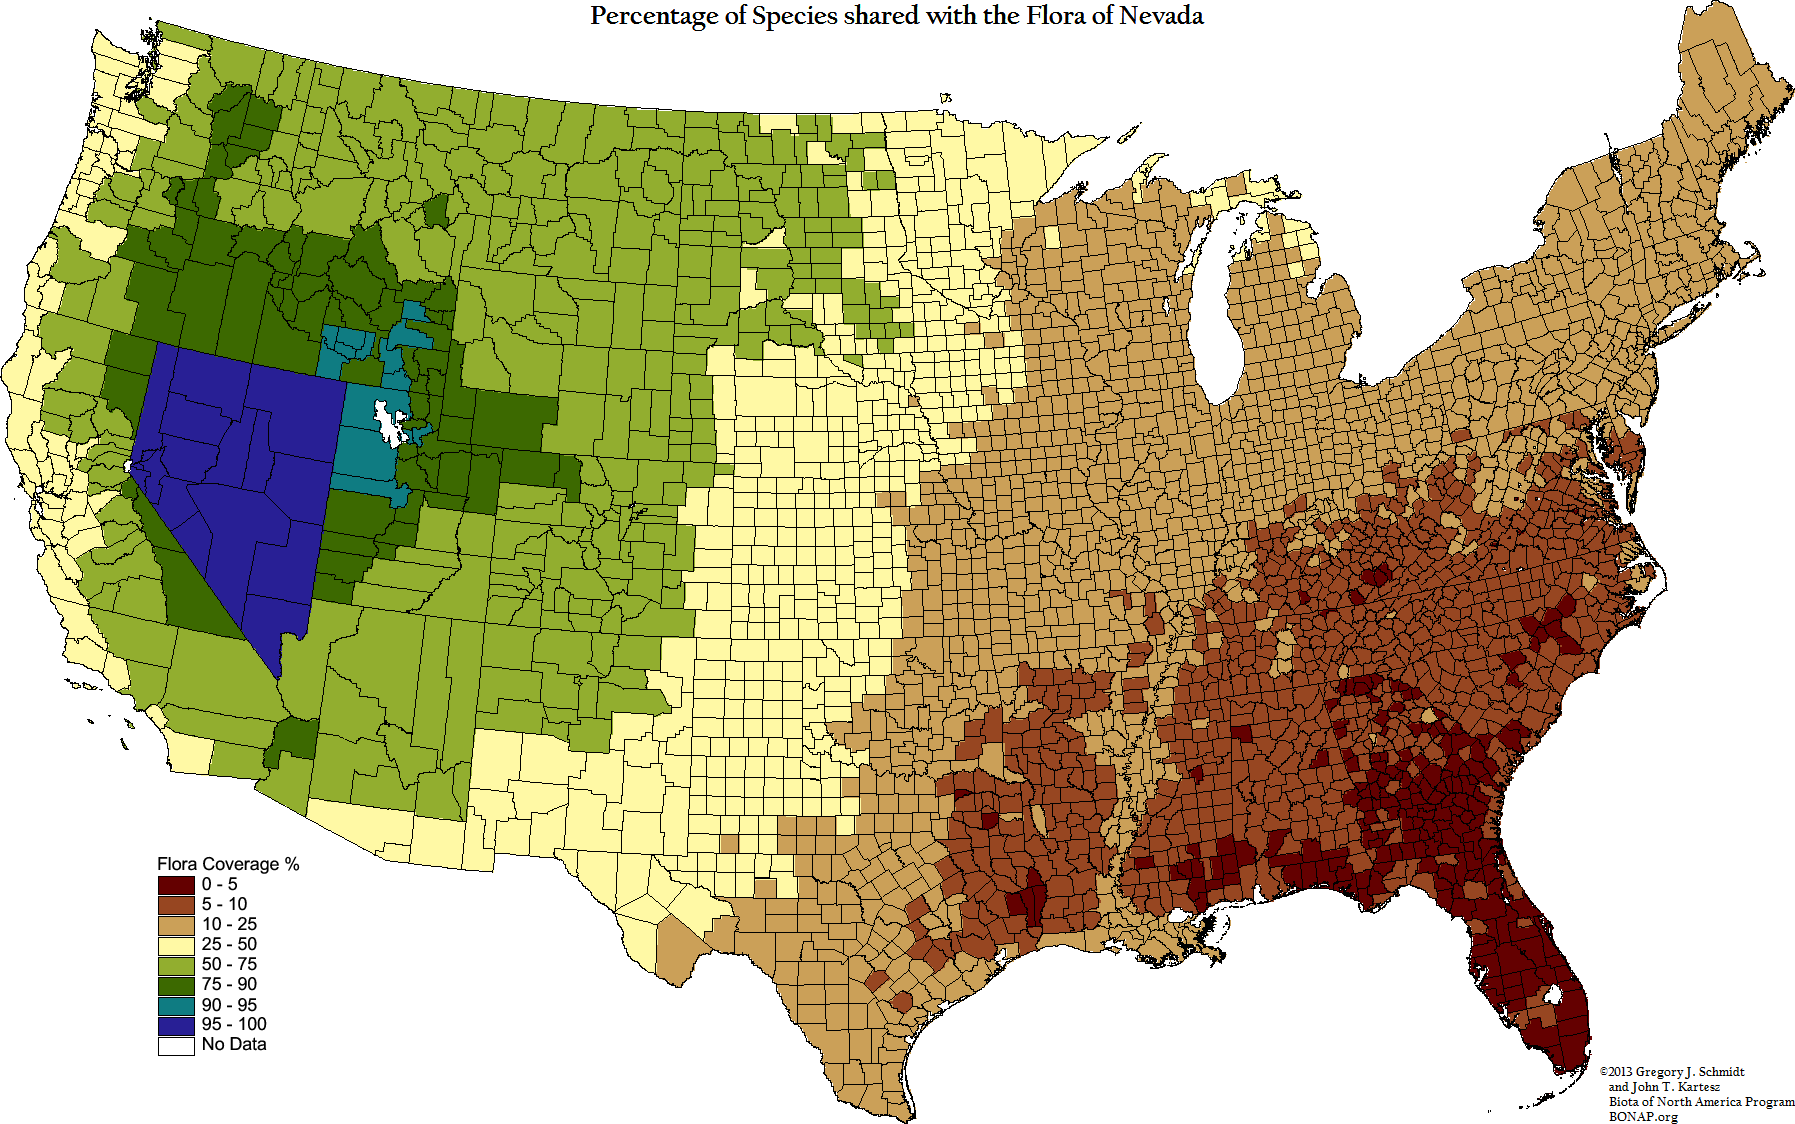
Perhaps the most peculiar pattern of all is the relatively low level of floristic similarity that exist between individual states of the Southwest,
such as Arizona (map #3), California (map #6), Nevada (map #25), and Utah (map #37), and counties adjacent to them in surrounding
states. For each of these states, there appears to be less than a 95% floristic similarity factor with those adjacent counties. Too, notice that
this pattern exists in New Mexico (map #27) and Colorado (map #9), but to a lesser degree. In fact, within the U.S., the pattern of floristic
sharing appears to increase gradually in all directions beyond the Southwest.
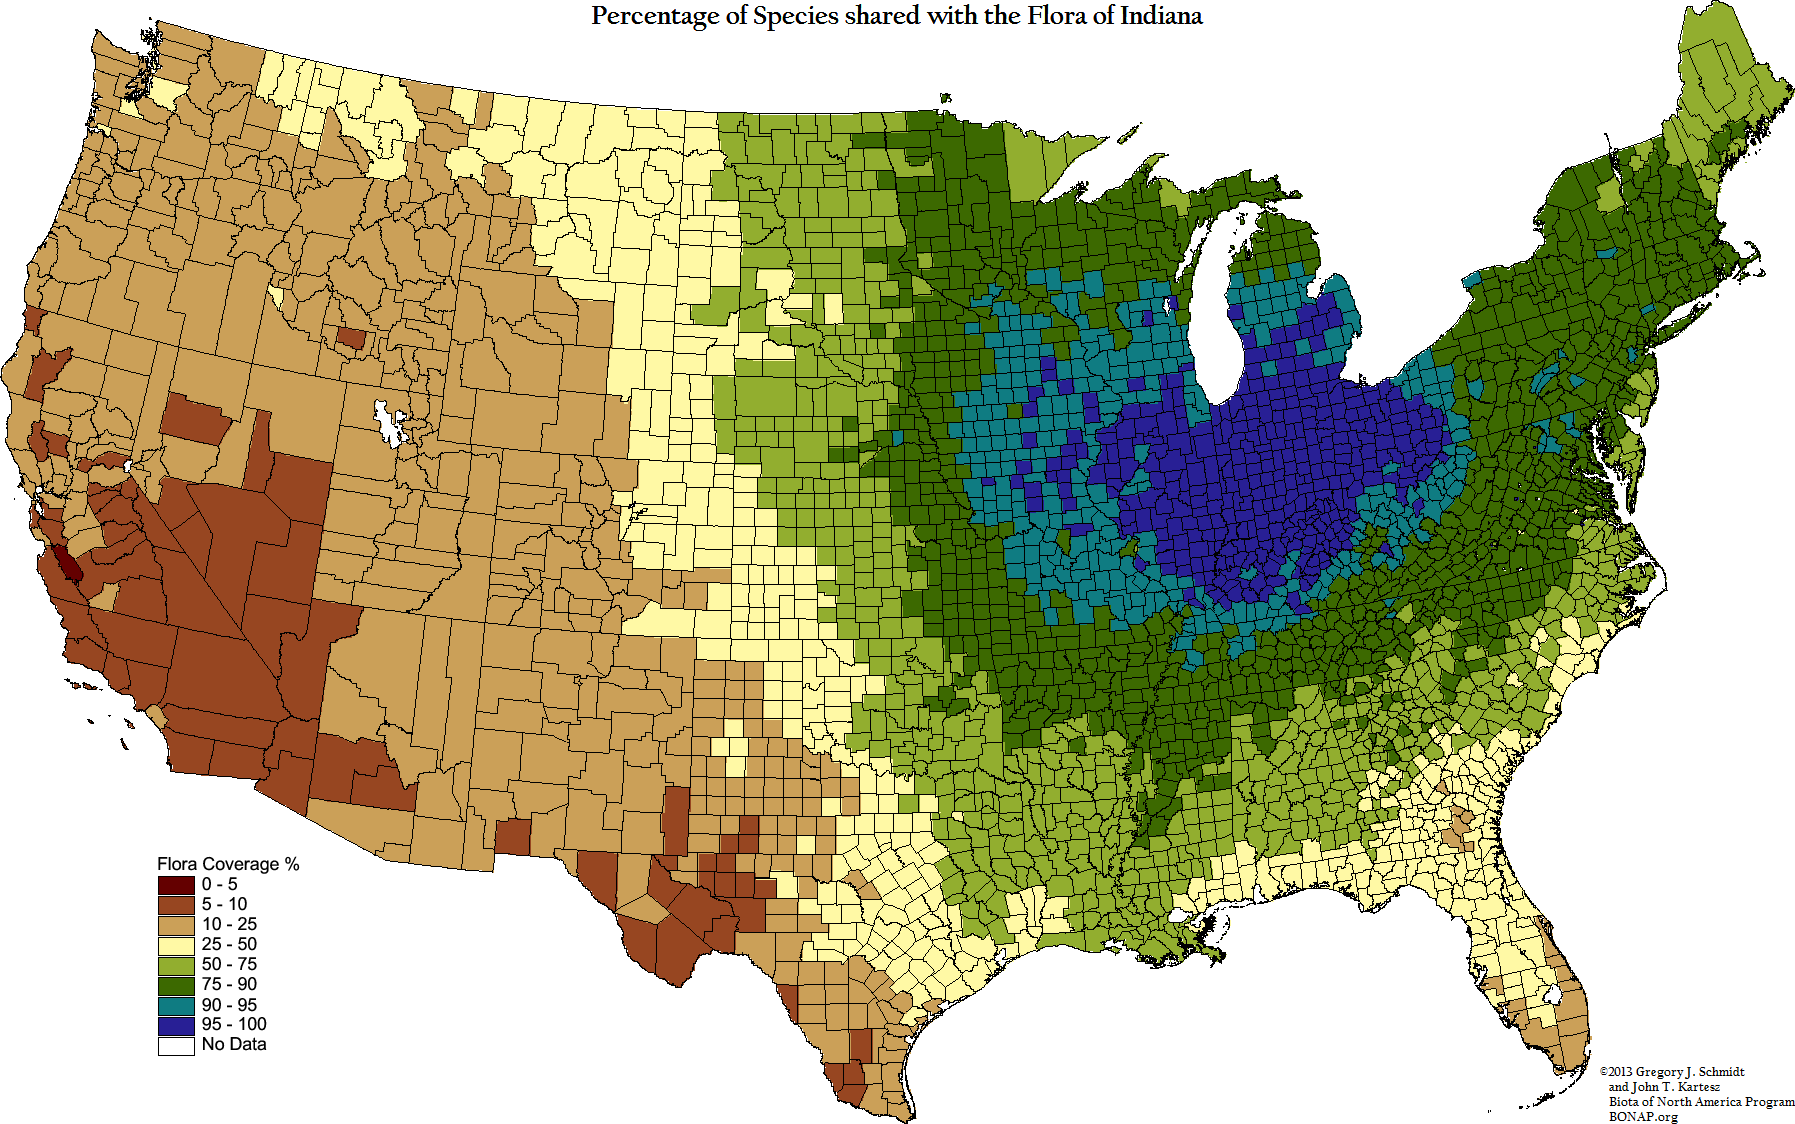
For example, look at the maps of Alabama (map #1), Georgia (map #12), Indiana (map #16), and Kentucky (map #18). Notice the high
percentage of floristic similarity that exists between each of these states, and counties of states adjacent to them. In fact, in some cases,
this high level of floristic similarity extends not only into counties of adjacent states, but far beyond that. I believe that there is a sound
biological explanation for this difference. Do you have any ideas on what it might be? Please let me know your thoughts.
There are many other suppositions and theories that can be developed by studying these maps. Although I have presented a few of the
more obvious ones here, please take time to analyze the ones in your geographic area, to see if other, more cryptic patterns or peculiarities
can be identified. We would greatly appreciate learning of any theories or suggestions that you might have regarding these maps. -JTK